 Svenesis.org
3 August 2026 · 🔭 Astronomy
Does My Camera Actually Suit My Telescope? Over- and Undersampling – and What Drizzle Really Gives You
I bought my rig in Texas second-hand, and while working my way into it I came across a stacking option called drizzle: a method that builds a finer image out of many slightly offset frames (dithering) than any one of them holds on its own. I read up on it – and that led me to the subject of sampling. Because drizzle only helps if you are undersampled – which raised a question I had never asked myself.
Does the pixel size of my camera actually suit the focal length of my telescope?
Here I work it through for my rig (William GT81 blue + 0.8× reducer + Ares-M Pro with the IMX533, at Starfront in Texas) and then come back to drizzle.
Two numbers – and the ratio between them
The whole subject hangs on two quantities.
The first: how much sky does a single pixel see? That is the image scale, in arcseconds per pixel (″/px). For a sense of scale: the full Moon is about 1800 arcseconds across – so at 2 ″/px it spans more than 900 pixels.
image scale [″/px] = 206.265 × pixel size [µm] ÷ focal length [mm]
The awkward constant is pure unit conversion: pixel size divided by focal length gives an angle in radians, and one radian is 206,265 arcseconds – divided by another 1000 because the pixel size is in micrometres and the focal length in millimetres.
The second: how wide is a star in the image? A star is so far away that it ought to be a pure point. It still comes out as a small disc, because three things smear it: the turbulence of the air (seeing), inaccuracies in the guiding, and the optics themselves. The width of that disc is measured as FWHM – full width at half maximum: you look for the point where the star is only half as bright as at its centre, and measure its diameter there. That is more robust than hunting for the edge, which fades away into nothing anyway.
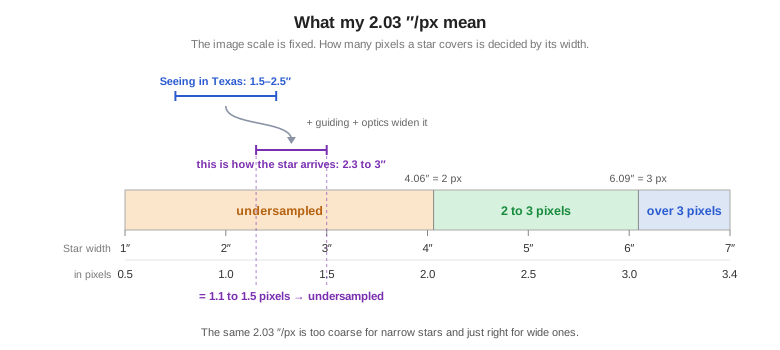
Sampling is the ratio of those two numbers: divide the star width by the image scale and you know how many pixels a star spans. And this is where it gets tight: the full Moon from a moment ago fills 900 pixels – a star, by contrast, is only a few arcseconds wide. At a typical 3″ and 2 ″/px, that leaves all of one and a half pixels.
Three cases
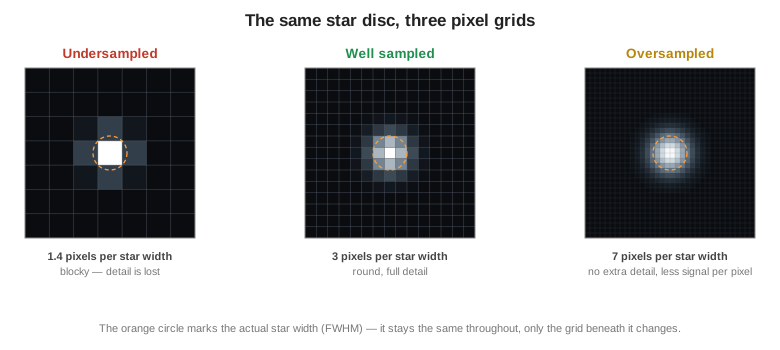
- One to two pixels per star width – undersampled. The star falls on so few pixels that its shape is no longer rendered at all. Fine detail is lost, even though the telescope delivered it.
- Two to three pixels – the sweet spot. Enough measuring points to render the star shape cleanly, without spreading the light unnecessarily.
- Considerably more – oversampled. The image does not get sharper for it, because the limit lies elsewhere entirely: with the seeing and the optics, not with the pixel grid. The same light is simply spread over more pixels – each one gets less, and you have to expose for longer.
How many pixels exactly? That is disputed
The figure quoted most often is Nyquist: two pixels per star width. At high magnification you can still see the pixel steps on the star's edge at that value; for a smooth profile, three to three and a half tend to be recommended. None of which has anything to do with how round a star is – that is decided by focus and guiding.
There is a serious counter-argument to that: staying deliberately undersampled collects the same light on fewer pixels and thereby improves the signal-to-noise ratio. Oversampling, conversely, costs signal without buying any resolution beyond the seeing limit.
In short: two pixels is the minimum, three is comfortable – and anyone optimising for signal may deliberately stay below that. This is not a limit you have to respect; it is a decision.
My example: William GT81 blue + 0.8× reducer + Ares-M Pro
Let us work it out:
- William GT81 blue, 478 mm native, with the 0.8× reducer-flattener → 382 mm (f/4.72).
- Ares-M Pro / IMX533: pixel size 3.76 µm.
- Image scale = 206.265 × 3.76 ÷ 382 = 2.03 ″/px.
- Field of view: 3008 pixels × 2.03 ″/px = 6110″ → about 1.7° × 1.7°.
And where does that leave me? Starfront in Texas is extremely dark (Bortle 1, SQM 21–22) and has good seeing – usually 1.5 to 2.5″, and on the best nights down to about 1″. On top of that come the guiding and the diffraction limit of my 81 mm aperture – the physical floor every optical system has, which at this size alone amounts to some 1.4″. Blurs like these do not simply add up, though – they add in quadrature: the largest contribution dominates and the smaller ones barely register. All told I arrive at a delivered star width of an estimated 2.3 to 3″ – divided by 2.03 ″/px, that is 1.1 to 1.5 pixels. For two pixels I would need 4.06″.
The measurement that was missing
Everything calculated so far rests on an estimated number: the seeing. “1.5 to 2.5 arcseconds in Texas” is a statement about the site, not a measurement on my image. As long as I do not know the delivered star width, my “undersampled” remains a supposition.
So I measured. That calls for single subs, individual raw frames – not the stacked end result, because stacking and registration change the star shape. Luminance is best – the clear filter of my mono camera, because it shows the most stars – with the target high in the sky and taken right after an autofocus run. And the median across many clean stars: saturated ones measure too wide, faint ones too uncertainly, and closely spaced ones contaminate each other.
What I am after in the end is a single number: pixels per star width. Around 2 would be the sweet spot, well below that means undersampled.
Which leaves the question of how you determine the star width in the first place. That sounds like the easiest part of the exercise. It was the hardest.
The result
On the night of 3 August I took two frames – deliberately two, because a single one would only be one sample. Both 15 seconds of luminance, each taken directly after an autofocus run, no stacking, no processing:
- 04:04 – NGC 7243, an open cluster in Lacerta, in the middle of the Milky Way, 68.5° high.
- 05:43 – NGC 7789, “Caroline's Rose” in Cassiopeia, an hour and a half later and a little lower at 63.0°.
You can see the direction of travel in the bare numbers already – pinning down the exact figure was the actual work. So, first, a single bright star from the first frame, pixel by pixel:
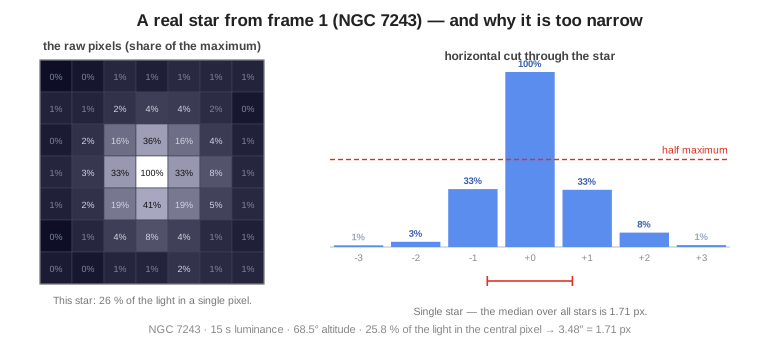
The middle five values of the central row read 3 % – 33 % – 100 % – 33 % – 8 %. One pixel away from the centre the star has dropped to a third, two pixels further out it is as good as gone. Vertically through the same centre it says almost the same thing: 4 % – 36 % – 100 % – 41 % – 8 %. So the entire star sits in a block of roughly 3×3 pixels.
The bar chart on the right shows that same row as a profile, with the red line at half the maximum – which is where the FWHM is measured. And here you can see the problem: only a single bar rises above that line. The whole star width is carried by one measuring point.
You can build a metric out of this, and the thought behind it is simple: a narrow star crowds its light into few pixels, a wide one spreads it over many. How much light lands in the brightest pixel therefore tells you how wide the star is.
For this star it works out like this: take the 7×7 pixels from the graphic, subtract the sky background, add up all the values – that is its total light. Of that, 26 % falls on the brightest pixel in the middle. Taking the median over all the stars in the image, it is 25.8 %.
Anyone wanting to check can do so directly on the graphic above: the 49 printed percentages add up to 386 – and 100 of those are exactly that 26 %.
A single night can of course happen to catch good seeing. So here is the same analysis again for frame 2, an hour and a half later:
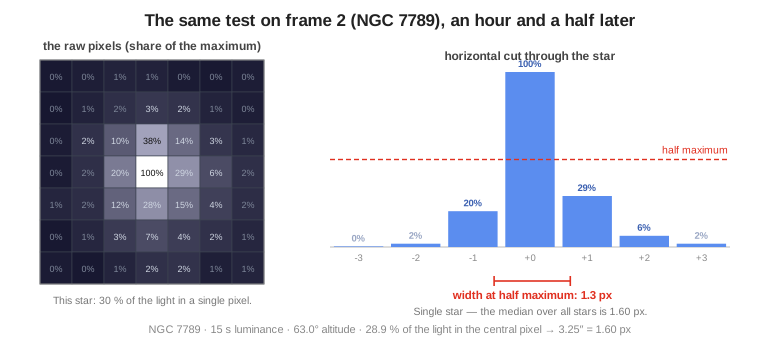
Here the middle row reads 2 % – 20 % – 100 % – 29 % – 6 %, and the brightest pixel holds 28.9 % of the light instead of 25.8 %.
That gives two measured values. What is missing is the translation into pixels – and that does not come from my images but from the maths: because a star has approximately the same bell-shaped profile every time, every width corresponds to exactly one share. A bell curve laid over a pixel grid, the same for every camera and every telescope:
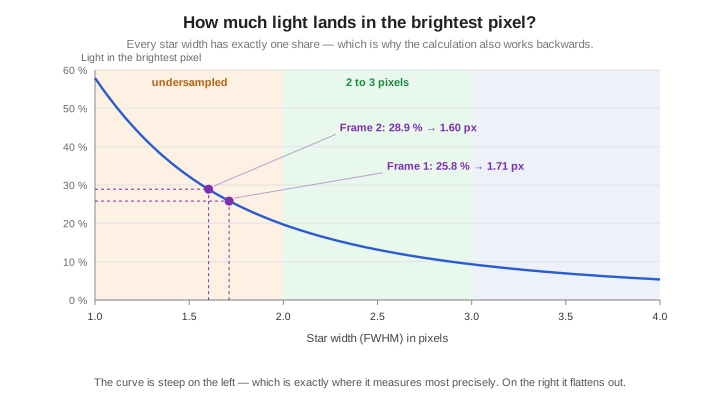
So the 25.8 % from frame 1 become 1.71 pixels, and the 28.9 % from frame 2 become 1.60. No curve fitting, just added-up pixel values.
And that also settles what the small difference between the two nights means – it reads backwards at first: more light in the central pixel means a narrower star. So frame 2 is the sharper exposure, and therefore the more heavily undersampled one.
The method comes with two caveats. First, the star has to sit roughly centred on a pixel. If it hits the boundary between two pixels its light is split and the share comes out too small – at my star widths, 17 instead of 26 %. So I only measure on centred stars; with 700 to 800 usable stars per image there are plenty of them.
Second, the conversion curve does contain an assumption after all, namely the Gaussian profile – and that is only approximately true. If I widen the measuring window from 7×7 to 17×17 pixels, the central share drops from 25 to 22 %, and the calculated star width rises from 1.74 to 1.90 pixels. With a genuine Gaussian profile nothing at all should change there, because outside 7×7 there would be no light left anyway. So my method is not entirely independent of the measuring aperture – just far less sensitive than the HFR, which I come to further down. None of which changes the finding: every value stays below two pixels.
The cross-check: four methods compared
I did not want to rely on a home-made method alone. So I ran both images through four established methods as well, over 811 and 718 stars respectively. You do not need to know the names – all that matters is that all four are supposed to measure the same quantity:
| Method | Frame 1 | Frame 2 |
|---|---|---|
| Radial profile | 1.66 px | 1.58 px |
| Half-max area | 1.60 px | 1.60 px |
| Sub-pixel stack | 1.58 px | 1.51 px |
| Gaussian moments | 2.38 px | 2.29 px |
Three methods land close together, the fourth comes out about 50 % higher – and by the same amount in both images. That is not an arithmetic error – it says something about the star: Gaussian moments weight the outlying wings heavily, and my profile has plenty of those. So the method measures the halo more than the core.
Which leaves the question of which value to believe – and there the cross-check is unambiguous: the three methods that agree give between 1.58 and 1.66 pixels for frame 1, my central-pixel method 1.71. Close enough to support one another. And not one of the values comes near two pixels.
The overall result
Median over all bright, pixel-centred stars in both frames:
| NGC 7243 | NGC 7789 | |
|---|---|---|
| Time | 04:04 | 05:43 |
| Altitude | 68.5° | 63.0° |
| Light in the central pixel | 25.8 % | 28.9 % |
| delivered star width | 3.48″ | 3.25″ |
| pixels per star width | 1.71 | 1.60 |
Two different targets, different altitudes, an hour and a half apart – and only 6 per cent between them.
Which answers the question: I am undersampled. A star width comes to 1.6 to 1.7 pixels on my rig – below the 2-pixel minimum. Of the three cases at the start, this is the left-hand one – though at its upper edge, not where stars turn into squares.
And that value is the favourable one. The calculation above had predicted 2.3 to 3″; the measurement says 3.3 to 3.5″. The reason is in the log of my guiding software PHD2, which records the guiding error every second: at the time of the two frames it stood at 0.62″ RMS in right ascension and 0.32″ in declination. And there is a trap here that is easy to fall into – a jitter with RMS σ does not widen the star by σ, but by about 2.4 × σ. So those values become an FWHM contribution of roughly 1.2″.
Update, 17 August 2026: The 0.62″ comes from the night of these two frames. I later analysed another night across two and a half hours and arrived at 0.78″ RMS there; the guiding contribution to star width is then 1.84 rather than 1.2 arcseconds. It does not change the verdict of “undersampled”, but it does change the error budget. The optimal sub length →
Which lets me open up the error budget in full: 3.48″ delivered, of which 1.43″ is diffraction and 1.2″ is guiding – leaving about 2.9″ of seeing. The site is quoted at 1.5 to 2.5″. So it was not the calculation that was wrong; the night simply was not a good one.
And the budget can be checked: because the guiding was twice as restless in right ascension as in declination, the stars ought to be marginally stretched in one direction – by 6 % on paper. Measured: 6 %.
But that also means: on a genuinely good night it gets worse, not better. At 1.5″ of seeing only 2.4″ of star width would arrive – 1.18 pixels. The calmer the air, the smaller the share of what it offers that my rig can still render.
Two measurements are not yet a distribution, and the seeing varies from night to night more than anything else about my rig. But the direction is unambiguous enough that I am not going to doubt it further.
What this means in practice
How far is that from ideal?
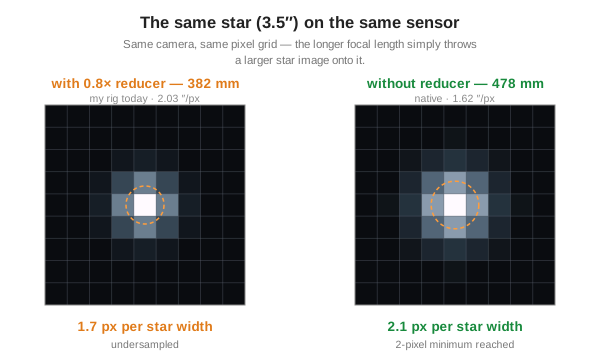
“Undersampled” sounds like a bigger problem than it is. For two pixels per star width I would need 446 mm of focal length – a mere 64 mm more than now. And I have had that all along: without the 0.8× reducer the William GT81 blue has its native 478 mm. So it would only be a matter of unscrewing a component:
And what about the HFR that N.I.N.A. displays?
My capture software N.I.N.A. shows an HFR after every frame – half flux radius, the radius containing half of the star's light. For frame 1 that is 1.50, for frame 2 1.47. By the widespread rule of thumb “FWHM = 2 × HFR” those would be 3.0 pixels – so I would not be undersampled at all.
But that formula only holds for a pure Gaussian profile, and my stars have markedly broader wings: at twice the FWHM distance there is still about 1 % of light left instead of 0.002 %. That inflates the HFR without widening the core. Accordingly the ratio of HFR to FWHM comes out at about 1.1 in both images instead of 2.0 – not a random value, but the signature of my star profile. On the direction, incidentally, both methods agree: frame 2 is the sharper one.
In short: HFR is an excellent focus indicator, but no substitute for FWHM.
What else the measurement revealed
Two things fall out along the way, and both support the finding:
- The stars are round (elongation 0.06 and 0.08). That rules out the gross faults: no drift, no backlash, no wind. What it does not rule out is a symmetrical guiding jitter – that widens the star without distorting it, and it is part of my 3.48″. More important is the reassurance that follows: undersampled does not mean the stars look bad. How round and crisp they are is decided by focus, guiding and optics. Sampling only limits how much detail makes it into the image at all.
- The field is even. From the centre to the edges the star width grows by only 7 to 14 % – no sign of sensor tilt or incorrect backfocus. Which makes it legitimate to average across the whole field.
Drizzle: what it gives you – and what it needs in return
Anyone who is undersampled has a tool: drizzle. And it is no amateur trick but a professional workaround: Hubble's wide-field camera is itself undersampled, and Andrew Fruchter and Richard Hook developed the method for exactly that.
The idea is in the name. Out of many slightly offset frames a finer grid is built: the original pixels are shrunk and projected onto a new, tighter grid – the brightness values “drizzle” onto the new pixels according to their overlap and are averaged over all the frames. Because every frame shows the star at a fractionally different sub-pixel position, the finer grid fills up bit by bit.
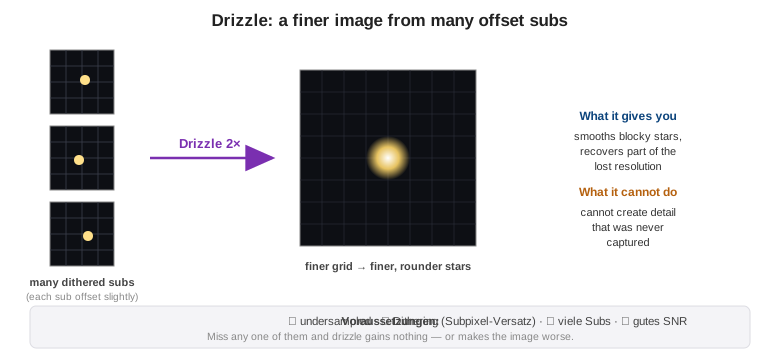
What it gives you: effectively finer sampling without swapping the optics – part of the detail that is lost in the coarse grid comes back. On heavily undersampled images it also smooths out the blocky-looking stars.
What it cannot do: create detail the sensor never captured. It does not overcome the limit set by seeing and optics, and it does not make defocused or distorted stars round.
The requirements – without them drizzle gains nothing, or actively does harm:
- You have to be undersampled. With critically or oversampled data drizzle brings no gain. As a rough limit: from about two pixels per star width upwards it hardly pays off. In forums you read the same rule as “below 1.5 ″/px” – at average seeing that is the same thing.
- Dithering between the subs (sub-pixel offset). That is the basic prerequisite – without a dither there are no sub-positions to reconstruct from. Fortunately you dither anyway, to get rid of hot pixels.
- Many subs. You are spreading the light onto a finer grid; without enough frames, gaps are left in it. In my own stacking script I drew the threshold at 40 dithered subs – below that it warns, because the finer grid is then filled unevenly and the result comes out noisier than a normal stack.
- Good SNR. Drizzle raises the noise (fewer photons per output pixel). With a thin signal the image gets worse, not better.
And two controls, not one. The well-known one is the scale factor – 2× is usual and recommended; going higher drives the number of frames you need into the unrealistic. The second is called pixfrac (drop size): how far the original pixels are shrunk before being projected. Too large, and the old coarse grid stays visible in the result; too small, and holes appear because not every output pixel gets hit. My Siril script has pixfrac=1.0, the full pixel – the safe option: guaranteed no holes, at the price of a smaller gain in sharpness. Going lower only pays once you have many, well-scattered dither positions.
The stumbling block you read about: drizzle classically does not get along with outlier rejection during stacking (sigma or median clipping). The reason: in the finer grid, pixels are only filled with values intermittently – and to the rejection algorithm such a gap looks like a rogue pixel, so it throws it out. In older programs you therefore had to choose.
When I read that, I looked into my own stacking script – and found that the question does not even arise there. Siril drizzles during registration, not during stacking: the scale factor and pixfrac belong to the seqapplyreg call, and what is stacked afterwards is the already drizzled sequence. So the rejection works on fully projected images and never sees a gap. The widespread warning comes from an older implementation of the method.
Which brings me back to my favourite theme: you can piece it together from forums – or look inside your own tool once and know.
Three of the four points are met in my case. The measurement gave 1.6 to 1.7 pixels per star width – undersampled. I dither anyway, and the dark sky delivers good SNR.
That leaves the frame count, and it is decided per channel: for SH2-129 I had 21 subs in Hα and 56 in OIII. By my own threshold of 40, drizzle would have been worth it for OIII, not for Hα.
Verdict for my rig: drizzle 2× is justified. On the measurement night with its 1.7 pixels the gain would have stayed modest – on good nights with 1.1 to 1.3 pixels it is not modest at all. The very frames that matter most benefit most. It still does not replace focal length.
Conclusion
The answer to the question in the headline: not perfect, but a fit. 1.6 to 1.7 pixels per star width – below the minimum usually cited, and well below it on calm nights. What I get in return is a 1.7° field of view and fast optics. For wide-field nebulae in narrowband that is exactly the trade I want to make: the reducer stays on.
What I learned most of all was something about the question itself. Pixel size divided by focal length takes ten seconds and answers half of it: the image scale is geometry and is fixed once and for all – how wide the stars actually arrive is decided anew every night. Two 15-second frames were enough to turn that into a measurement rather than an assumption. The effort bears no relation to how long I had been puzzling over it beforehand.
I learned the most at the point where it first went wrong: four established measuring methods gave values on the same image that differed by half. That was not a mistake in my arithmetic, it was the diagnosis itself – with so few pixels per star, no method has enough to go on any more. One way you notice you are undersampled is that the measuring instruments start to argue.
🔭 The rig behind it: My rig @ Starfront in Texas · Why I dither anyway: Dithering → · Where the HFR comes from: Autofocus in N.I.N.A. →