 Svenesis.org
18 September 2026 · 🔭 Astronomy 🖥️ Technology
The observing planner: 13,600 objects, an interactive star map, and whether one person can really get this accurate
After the Astro Weather page I could not leave it there. The weather tool answers the question of whether the night will be any good. The other half was missing: and then what do I do with it? Which objects climb high enough, when do they culminate, where is the moon in the way, and what else happens in the sky that night?
Programs like that exist. But the question that really got me was a different one: can I build a planning tool that is not merely pretty but accurate? With an interactive star map, with real catalogues instead of a handful of famous names, and with numbers that survive a check against the people who do this professionally. No libraries, no server, all of it in the browser.
The answer is yes – and, to be honest about it: yes, with Claude. More on that below, because the most interesting lesson of the project hangs on exactly that.
What came out of it
The observing planner takes a place and a night and works out everything else – in the browser, with no account and no server. It shows the moon with its phase and the moonless darkness, a star map for any moment of the night, a ranking of the best objects, the planets’ visibility and the events of the night.
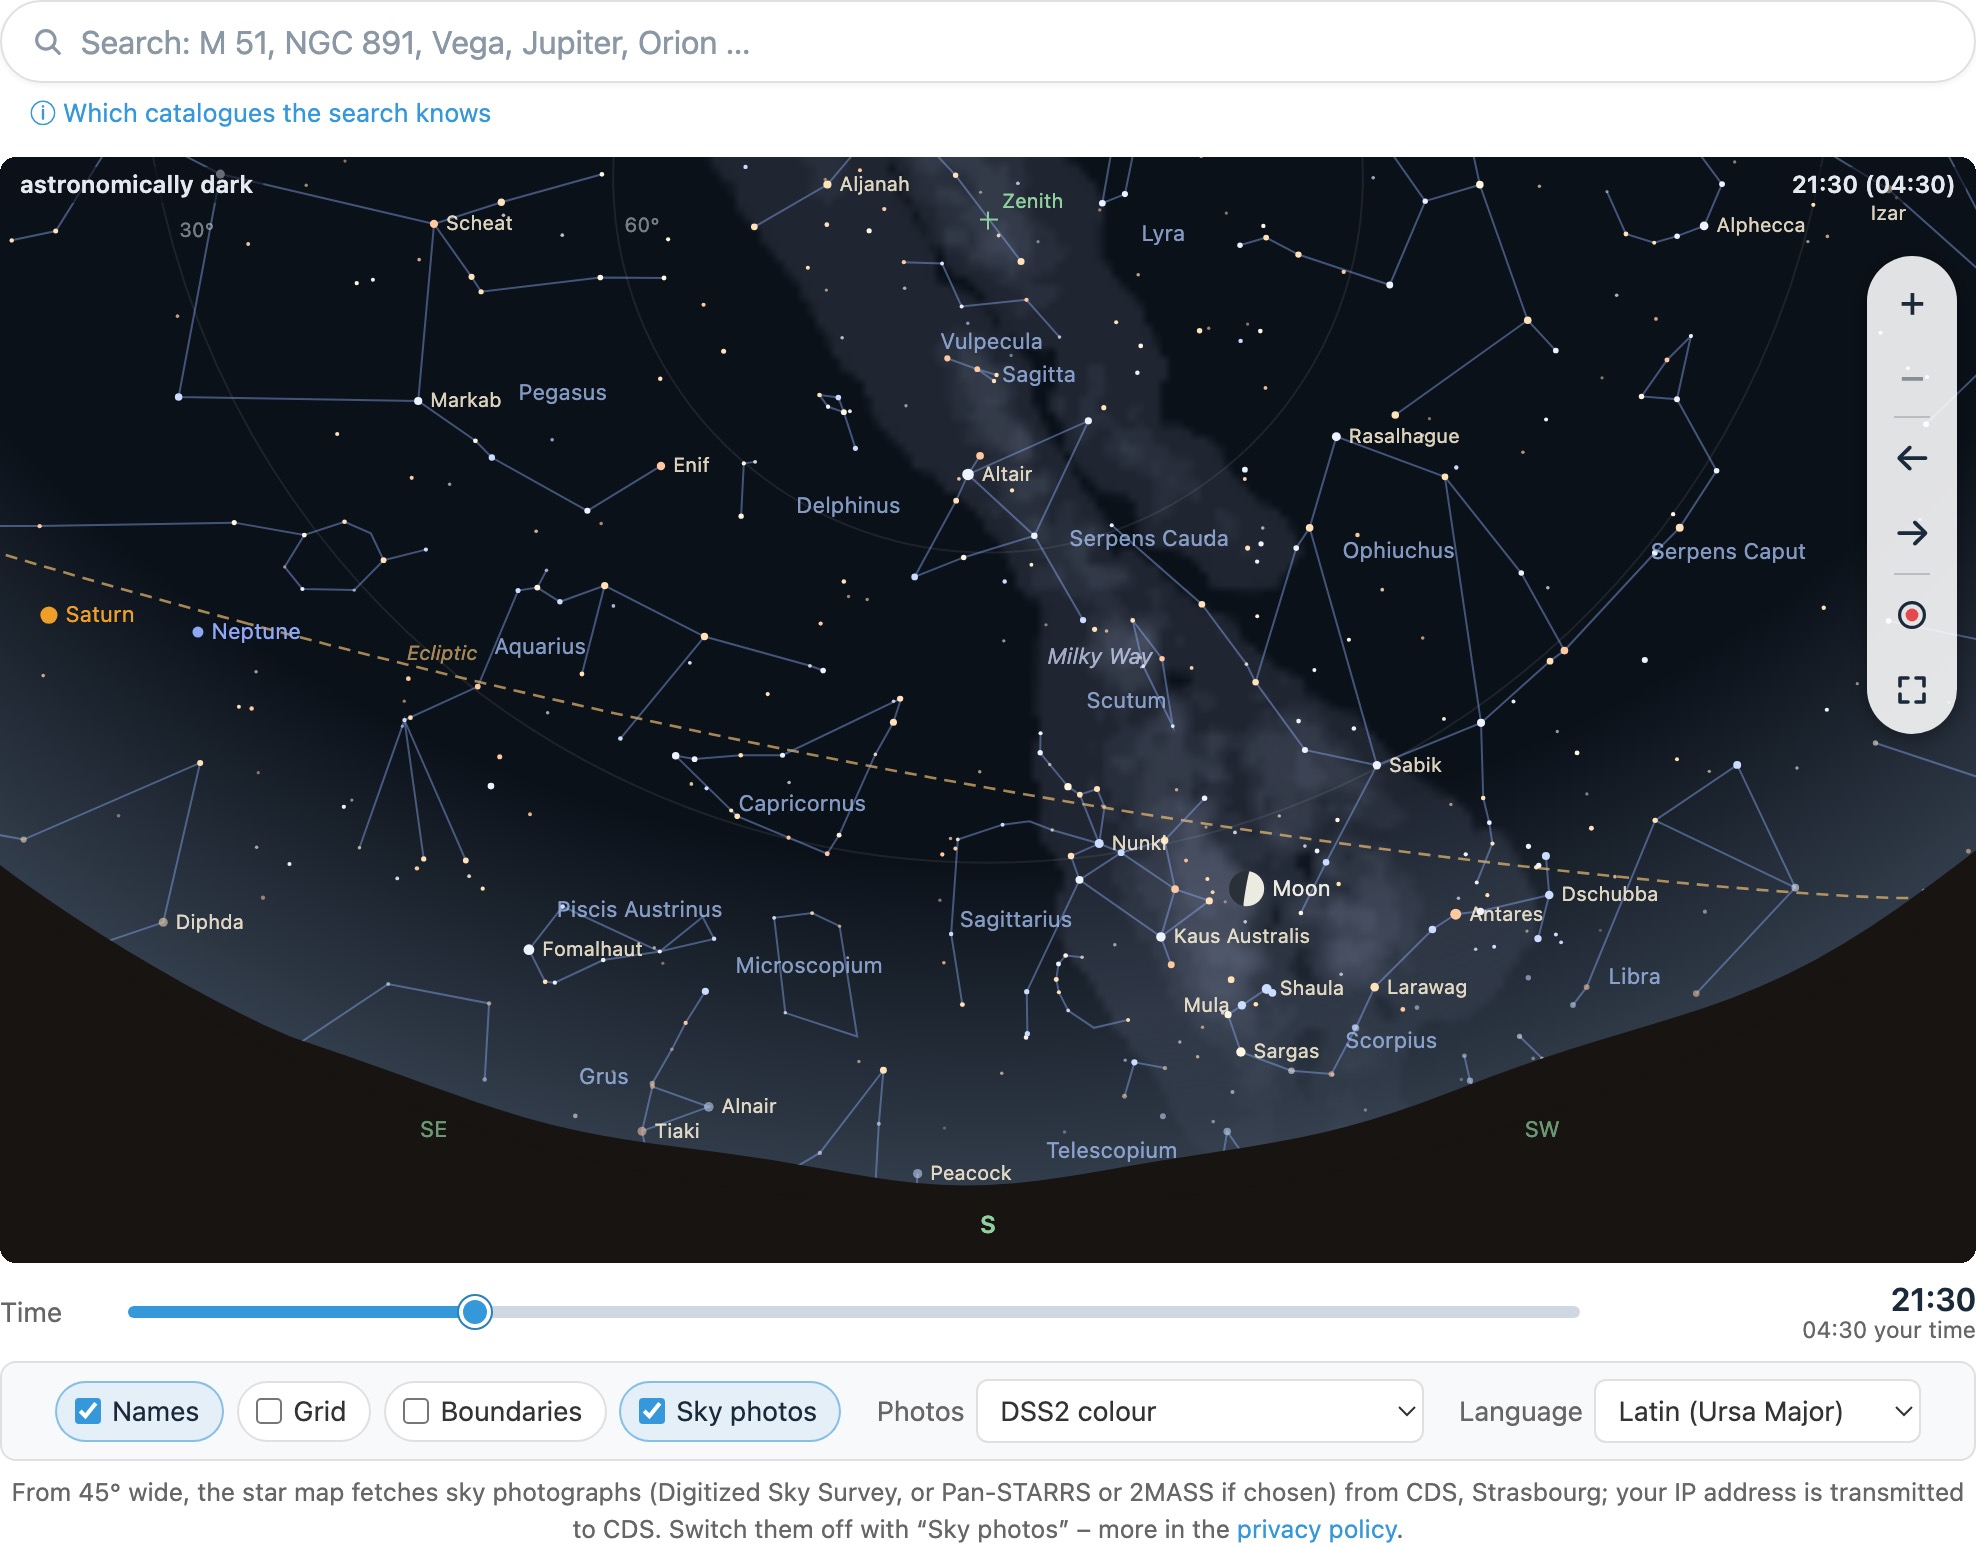
The map is not a picture but a calculation: stars are moved from epoch 2000 along their proper motion into the night, precessed rigorously, corrected for nutation and annual aberration, and finally lifted by atmospheric refraction – so that they stand in the same frame as the moon drawn beside them.
Zoom in until the photograph appears
Zoom to 45° across or closer and the map lays real photographs of the sky under the stars: an image from the Digitized Sky Survey, or from Pan-STARRS or 2MASS if you prefer, tiled and transformed from their J2000 frame into the night’s.
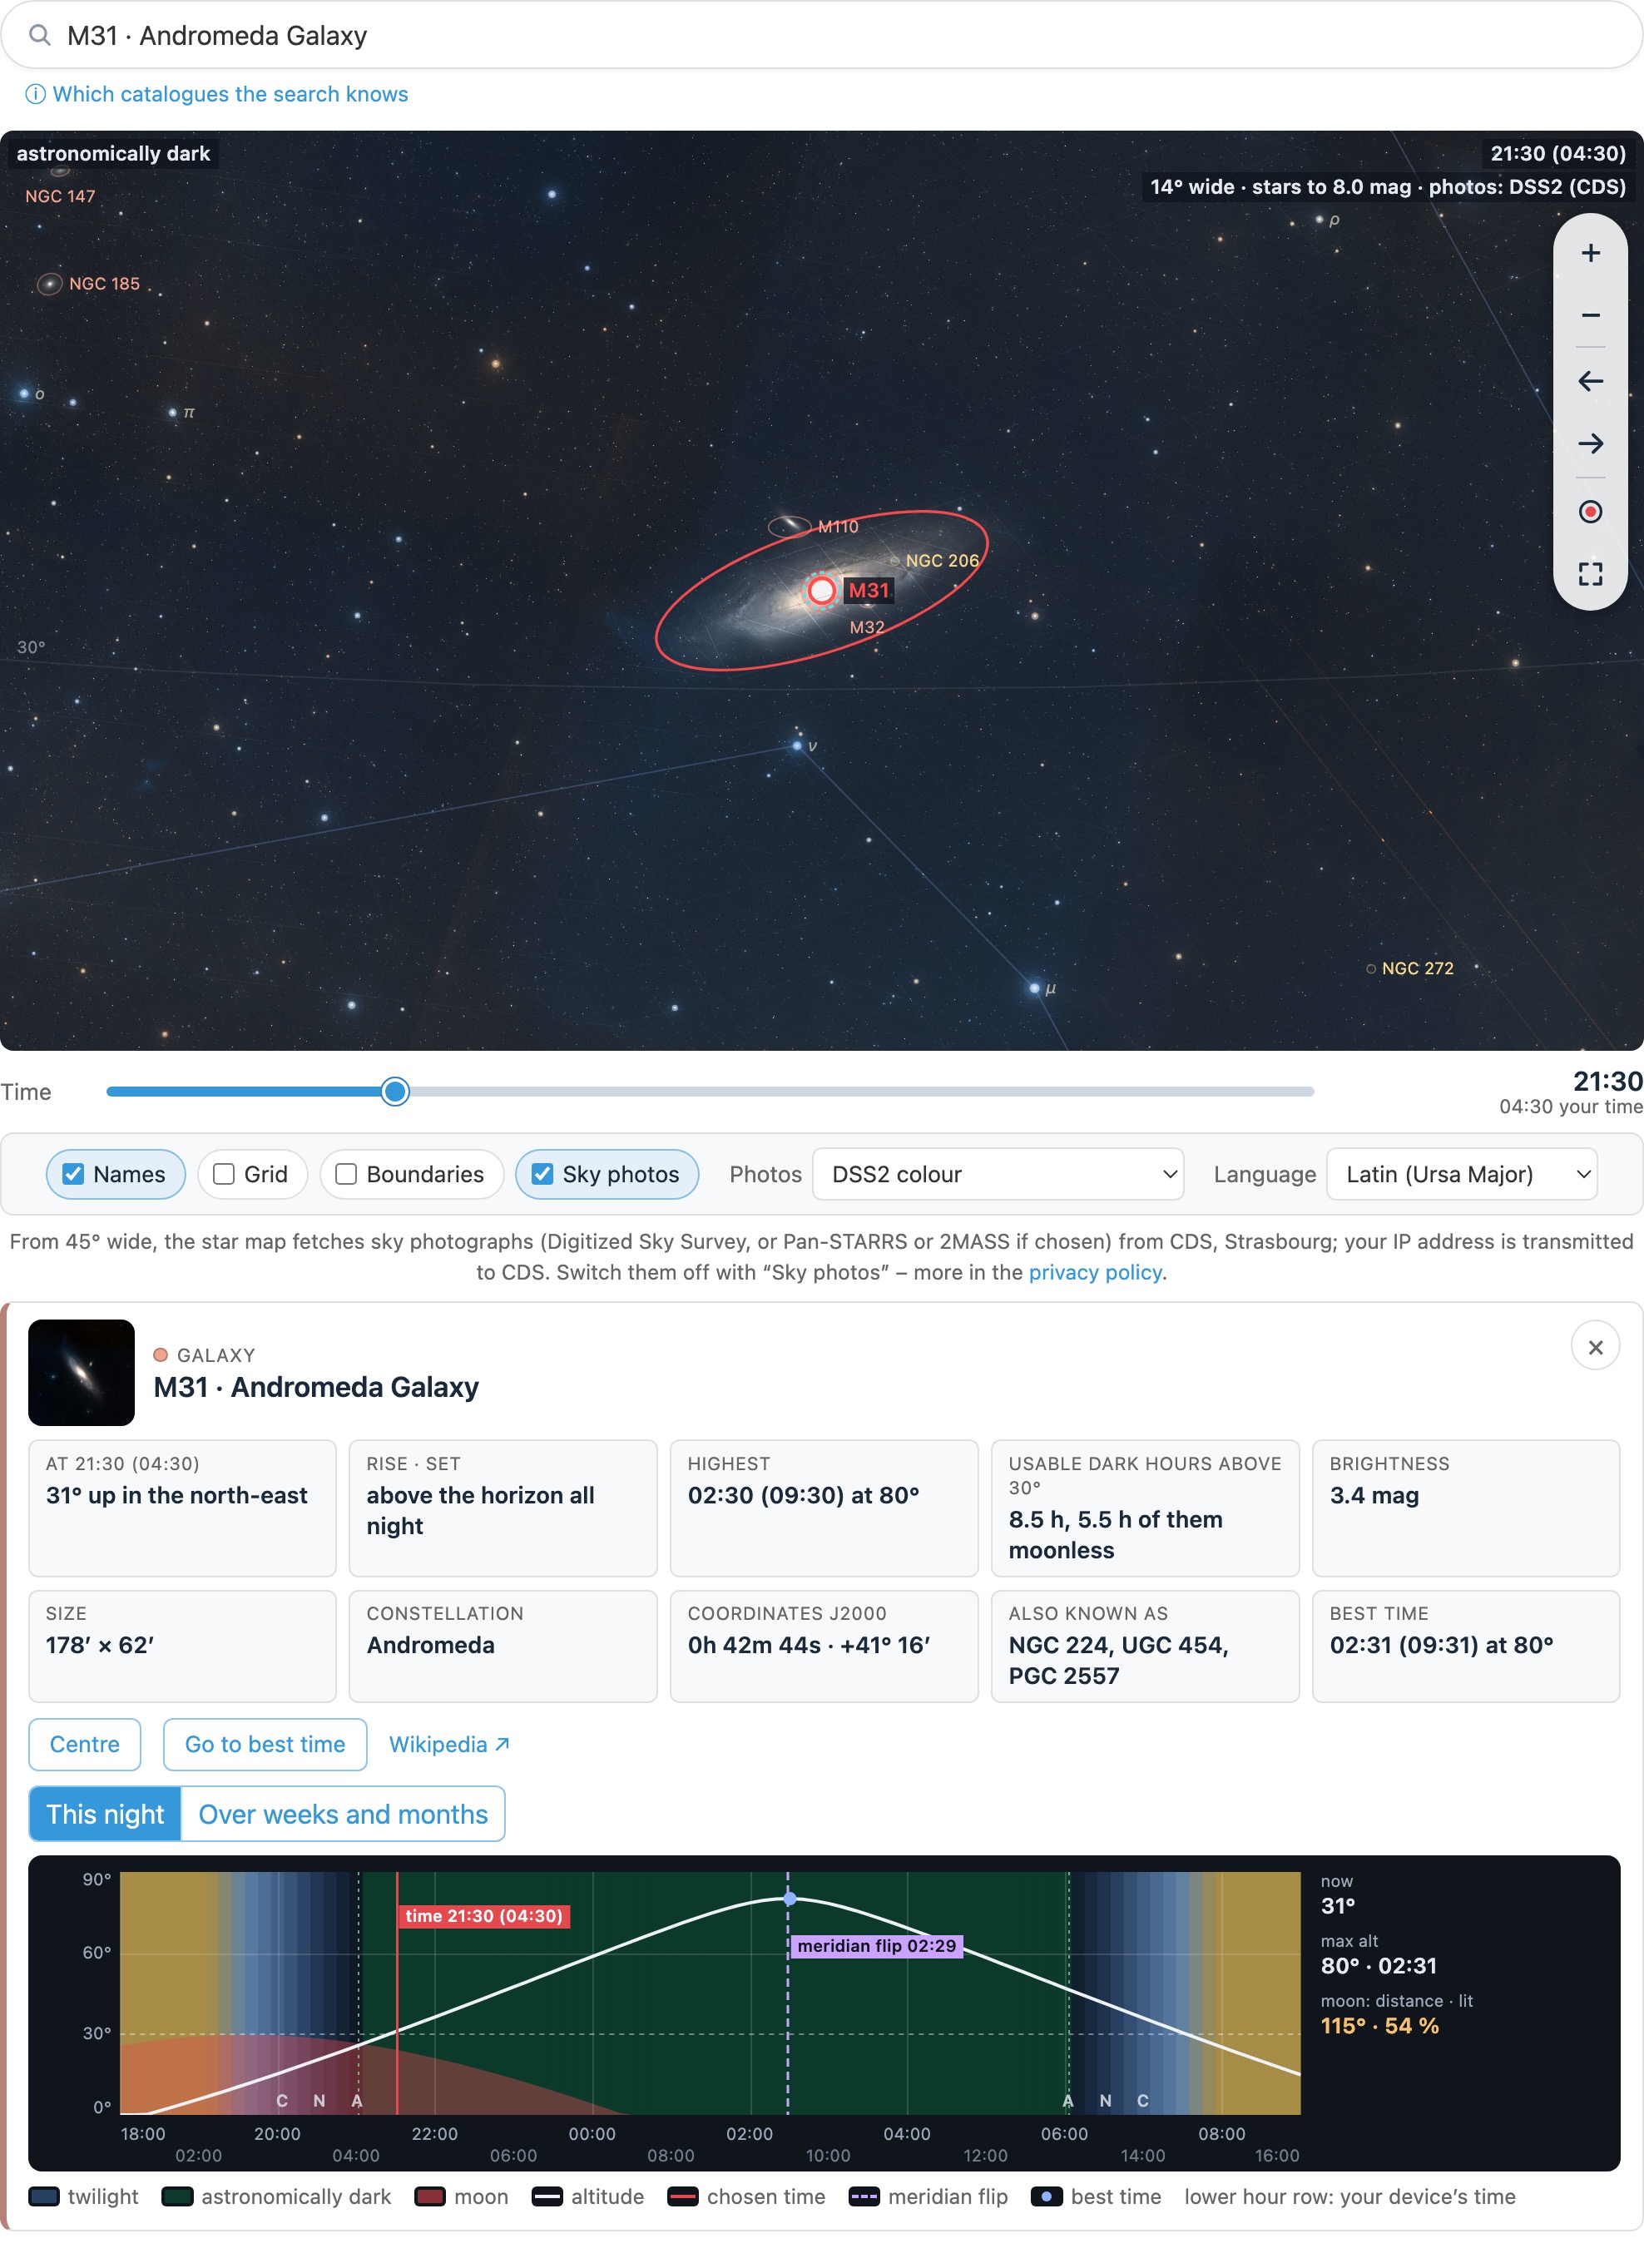
That card is where the planning actually happens. Highest at 02:30, 80° up, 8.5 hours of usable darkness above 30°, 5.5 of them moonless, plus size, magnitude, constellation, the other catalogue numbers and a link to the Wikipedia article. A second tab shows the same assessment across weeks and months – which answers whether this object is due now or will sit better in six weeks.
The best objects of the night – and what “best” means here
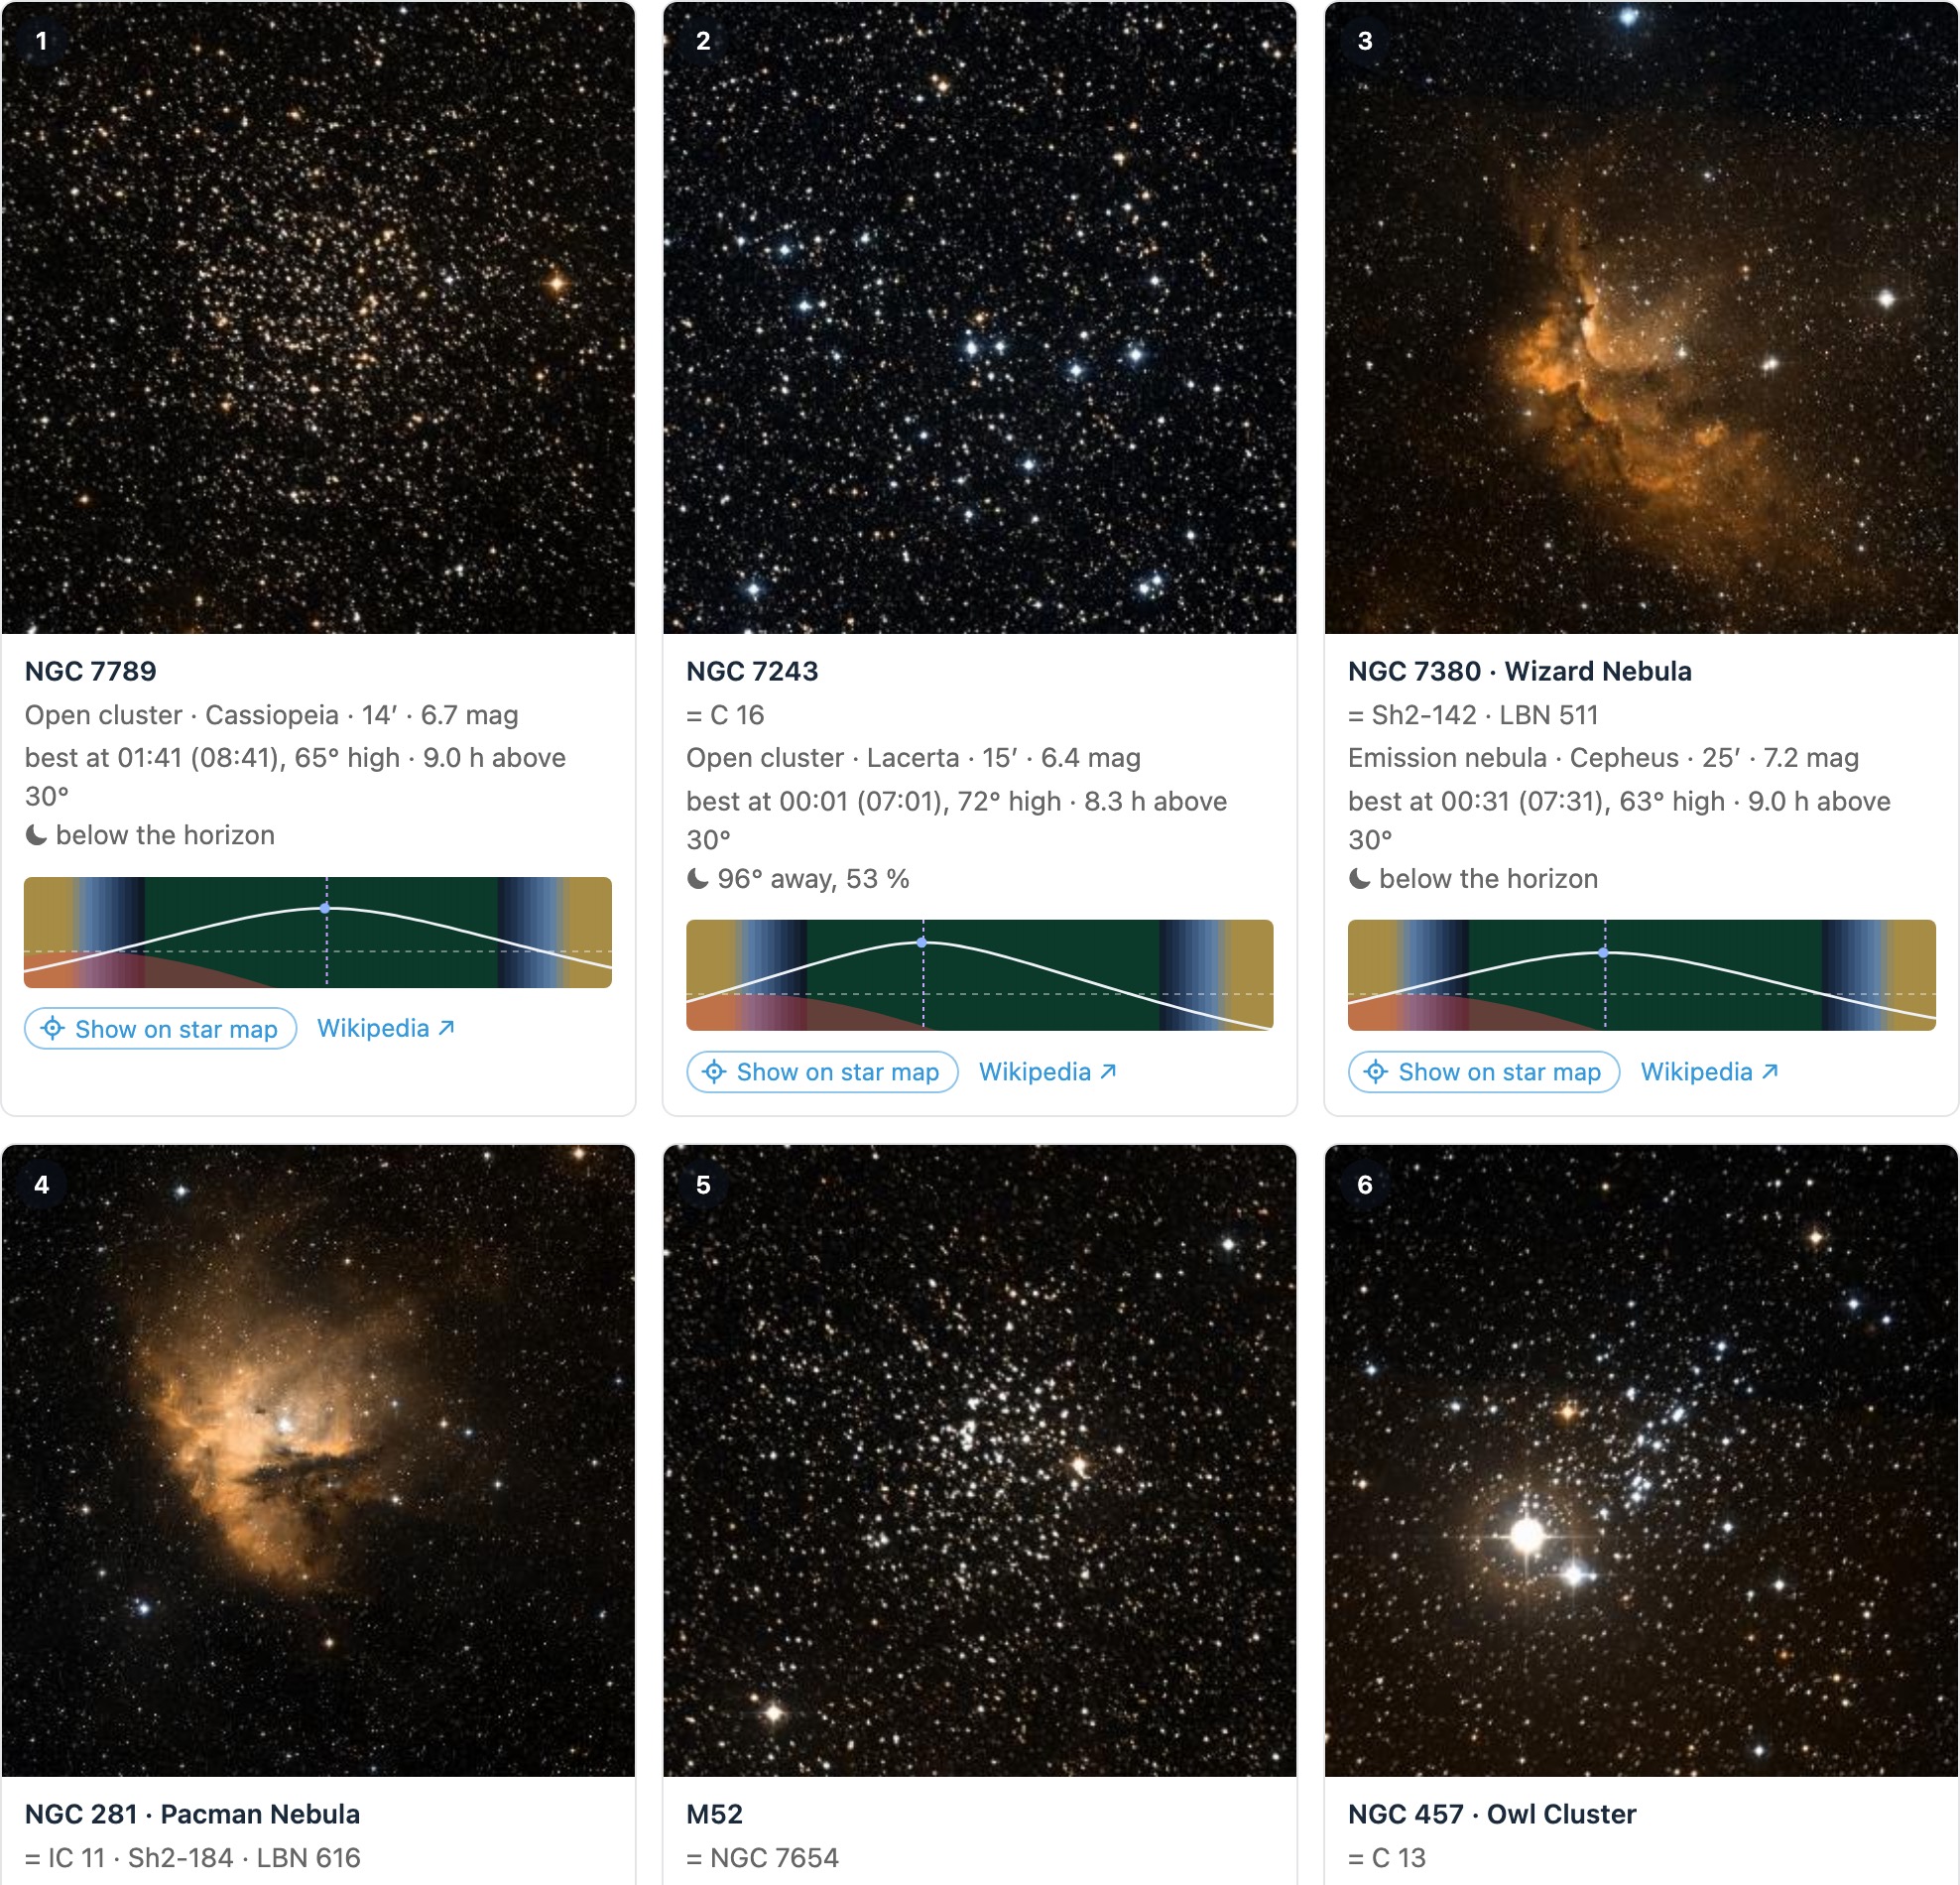
A ranking needs a measure, and an honest measure needs a purpose. So there are two modes. For the eye, magnitude, surface brightness, altitude and the moon decide. For imaging, the rating is tailored to my own rig: a 1.69° field, 2″ per pixel, narrowband filters. An object two arcminutes across is barely sixty pixels wide there and is rated down; an emission nebula minds the moon far less than a galaxy does, because a 4.5 nm filter sits in front of it.
This is not a universal ranking, and it says so above the table. A different telescope would produce a different order – but a ranking without a rig is a ranking without meaning.
What else happens that night
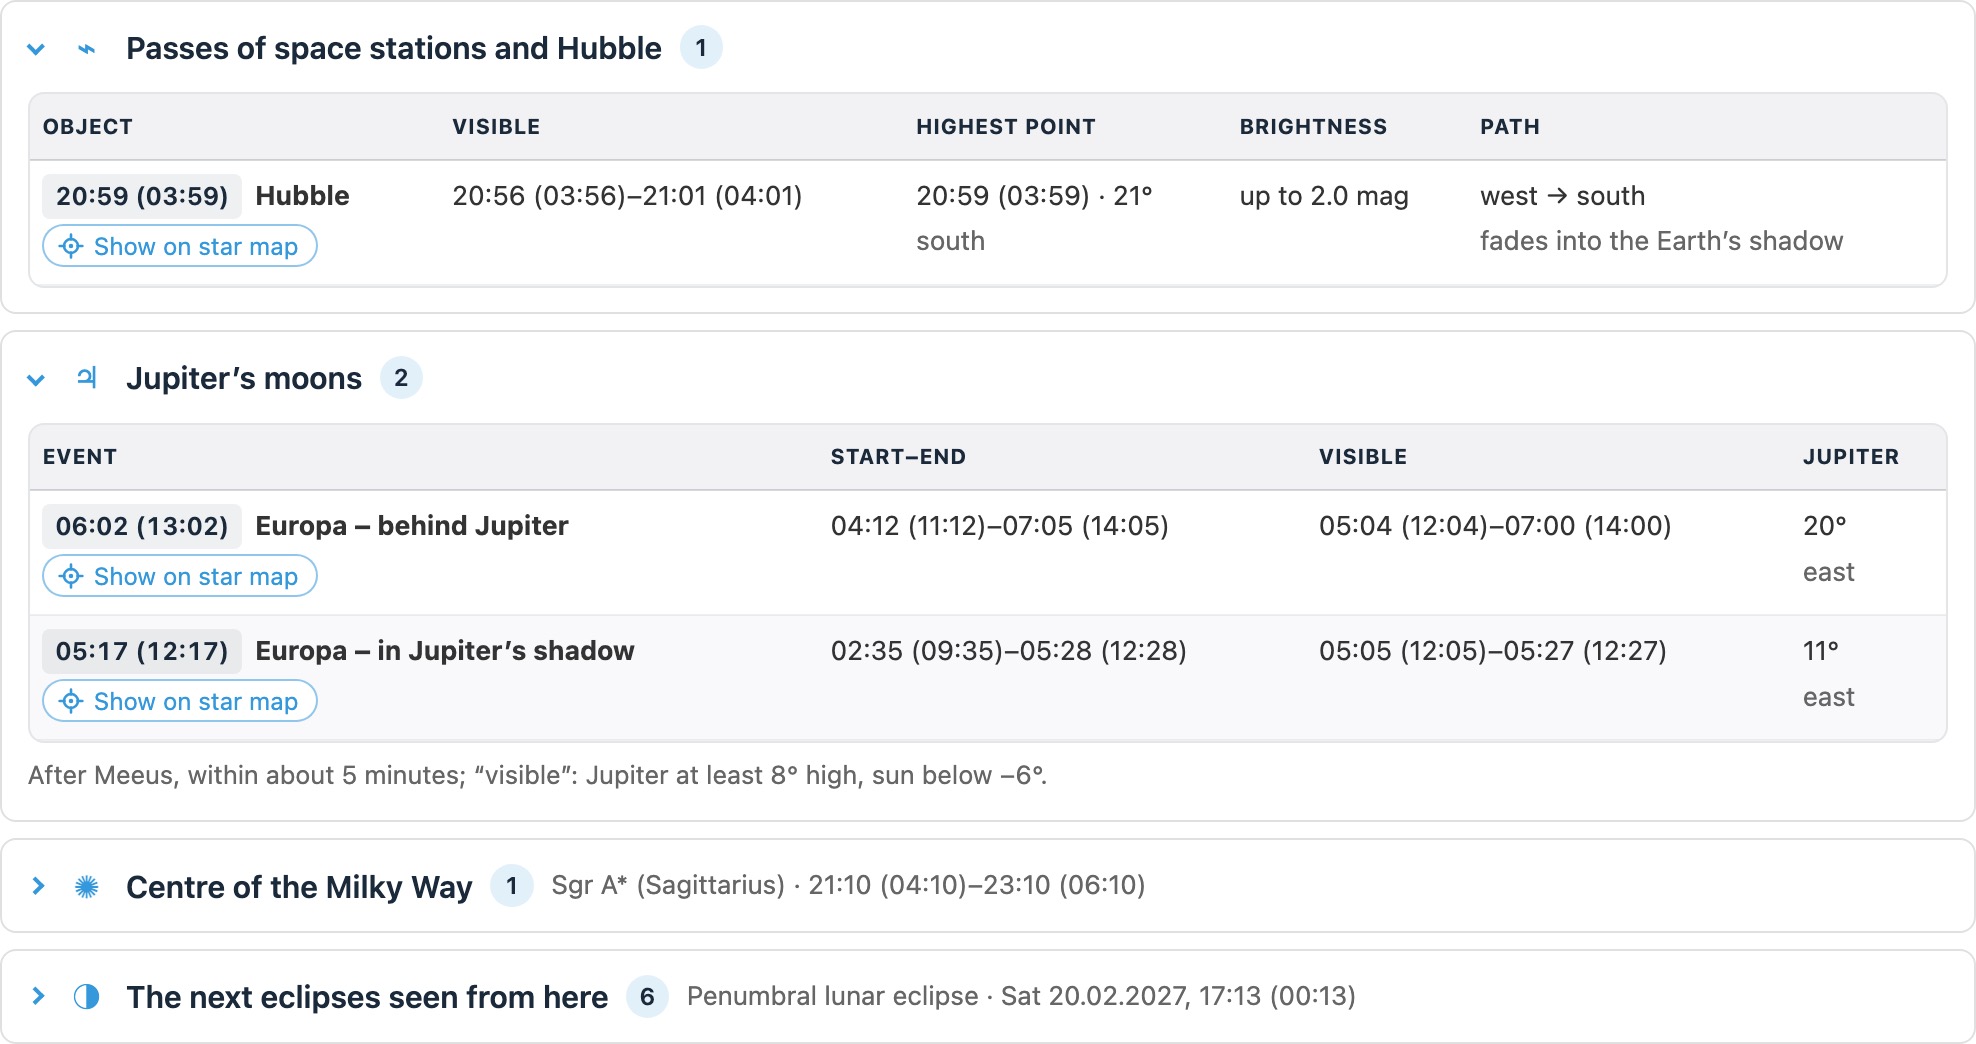
This is the part that is mostly computation and hardly any display: passes of the ISS, Tiangong and Hubble from orbital elements with the SGP4 model, lunar occultations of stars, eclipses and transits of Jupiter’s moons, meteor showers with an estimated rate, comets, close approaches of the moon and planets, transits of the space station across the sun and moon, the altitude of the galactic centre – and solar and lunar eclipses for the years ahead, with their local visibility.
The catalogues: 13,600 objects, each with a picture and an article
It started with 168 hand-maintained objects. That is enough for one evening, but not for the question “and what exactly is that NGC 7380 over there?” Today it holds:
- OpenNGC by Mattia Verga under CC BY-SA 4.0: every Messier, NGC and IC object, a good 10,700 galaxies and with them the clusters, nebulae and star-like entries – including the ten entries that do not exist, so the search can say so instead of staying silent.
- The Sharpless catalogue of HII regions (1959), by way of VizieR, with positions and names from SIMBAD.
- The Caldwell list from the English Wikipedia, as cross-references to objects that are in the catalogue anyway.
- Stars to magnitude 6.0 with every IAU proper name and Bayer letter, plus a binary file down to magnitude 8.0 that is fetched only once you zoom in far enough; proper motions and parallaxes from the Hipparcos new reduction.
- Double stars from the Washington Double Star Catalog, filtered down to what an amateur telescope can actually split.
Two things about this were more work than the star map. First: every row has a picture and a Wikipedia link. The pictures are 13,600 cut-outs from the Digitized Sky Survey, made once and self-hosted rather than hotlinked, so that browsing the list does not send every visitor’s IP address to somebody else’s server. The articles come from a run against the Wikipedia API; where there is no article, the link goes to the search.
Second: the same object is called something different everywhere. M42 is NGC 1976 is Sh2-281. C 30 is NGC 7331. The card shows those cross-references, and the search finds an object under any of its names – spelt out, with leading zeros, or typed without the German umlaut. It cost me an evening to work out that M102 points at M101 in one catalogue while really being NGC 5866.
And now the honest part: yes, this happened with Claude
I would not have written this on my own in the time it took. SGP4 from the literature, the lunar series from Meeus with its 60 terms, the HEALPix tiling of the sky photographs, rigorous precession – that is material where an amateur either reaches for a library or spends half a year. With Claude as the tool it turned into a matter of evenings.
The catch: code that looks plausible is especially dangerous in astronomy. A formula with a sign error does not raise an exception; it produces a moon that stands 30 arcseconds off – and that looks perfectly fine on a star map. There were plenty of those:
- The first six lunar terms instead of the full series: up to 0.37° out.
- An approximation for precession that divided by a tangent near the celestial pole and threw the corner of a photo tile thousands of pixels away – a bright streak across the view.
- A wrong sign on Jupiter’s moons that hid the ones in front behind the planet.
- A geocentric sun in the eclipse maths: 8.8 arcseconds of parallax, and Madrid came out inside totality when in fact it sits just outside.
I did not find those by reading the code but by recomputing against sources that must know better. Out of that grew what is really the heart of the project: a check script that now runs 120 tests, without a browser, and goes over everything on every change.
| Checked against | Result |
|---|---|
| US Naval Observatory (altitude and azimuth at four sites, both hemispheres) | stars within 0.03°, planets and moon within 0.08°, the sun within 0.01° |
| JPL Horizons (Uranus and Neptune over 20 years, Jupiter’s moons, Saturn’s rings, lunar libration) | positions within 0.034°, Jupiter’s moons within 2.5″ |
| NASA and EclipseWise (14 lunar eclipses 2025–2030) | contact times within a minute |
| RASC Observer’s Handbook (the Regulus occultation at three sites) | within 12 seconds |
| The SGP4 verification cases from Vallado’s paper | agreement to better than a millimetre |
Every one of those lines was a bug once. And that is the lesson I take from the project: the AI took the writing off my hands, not the responsibility. The gain is not that something appears quickly – it is that the time saved goes into checks there was never time for before.
What the page gives away about you
Almost nothing, and that was a design decision. Sun, moon, planets, comets, satellites, the whole star map – your browser computes all of it. There is no server that knows where you are looking, no sign-in and no stored settings: the place, the night and even the map’s viewing direction live in the address bar, so a link to a night is simply that link.
There is one exception, and it is labelled: the sky photographs come from the Centre de Données astronomiques de Strasbourg and are fetched only once you zoom into the map. A note under the map names them, and a tick box turns them off. Unlike Astro Weather there is no password for custom coordinates here – no third-party API is involved, so anyone can enter any place in the world.
One consequence of the image rights is worth mentioning too: the Digitized Sky Survey material is free for non-commercial use. That is why the planner pages carry no advertising and no donation button, while other pages of this site do.
Conclusion
“Is tonight worth it?” has turned into “and what do I do with it?”, and both now run in the browser, with no account and nobody else’s data centre. The planner is not finished – it grows with every question I ask myself before a night. The latest addition is the figure I care about most: how many usable dark hours an object spends above 30°, and how many of them without the moon.
And the original question, whether one person can get something like this genuinely accurate? Yes – if you are willing to check every number against someone who knows better. That is precisely the part no AI takes off your hands.
🔭 The tool: Observing planner → · The other half: Astro Weather and where its data comes from → · The rig the imaging rating is made for: Starfront in Texas →