 Svenesis.org
18 September 2026 · 🔭 Astronomy 🖥️ Technology
Is tonight worth it? My Astro Weather page – and where every number in it comes from
The same question comes up before every night: is it worth starting the rig? The weather apps on my phone do not answer it. They tell me whether I need an umbrella – not whether there will be a gap in the high cloud during astronomical darkness between 10 pm and 4 am, whether the jet stream will smear every star, and whether the moon will be in the way at exactly that hour.
What finally set it off was a discovery: Open-Meteo offers a genuinely good free API – clean data from the official models, with no account, no key and no registration. And an astro weather display that I can read at a glance was something I had wanted to build for a long time. With a data source like that there was no reason left not to.
So I built the answer myself: Astro Weather, seven days at a glance, made for that one question. It runs entirely in the browser, with no account and no app. This article shows what it displays – and above all where every single number comes from: what is model output, what is my own estimate, and where your IP address goes along the way.
The four locations you can look up
The drop-down is short, and deliberately so – the reason is further down. These are the places where I observe, or have someone observe for me:
- Starfront, Rockwood (Texas) – my remote rig, and the place the screenshots in this article come from. HRRR runs there at 3 km, and after about two days GFS takes over.
- Public Observatory Hannover – my observatory on my doorstep. Here the DWD’s ICON-D2 covers the first days at 2.2 km.
- Sankt Andreasberg Observatory – the dark sky of the Upper Harz, two hours by car. ICON-D2 as well.
- Finca Olivar, Gaucín (Spain) – Andalusia, much further south and drier. Spain lies outside the D2 area, so ICON-EU runs there at 7 km.
On top of those there is a custom coordinates entry for anywhere in the world – the only one I had to put behind a password. More on that below, too.
Seven days at a glance
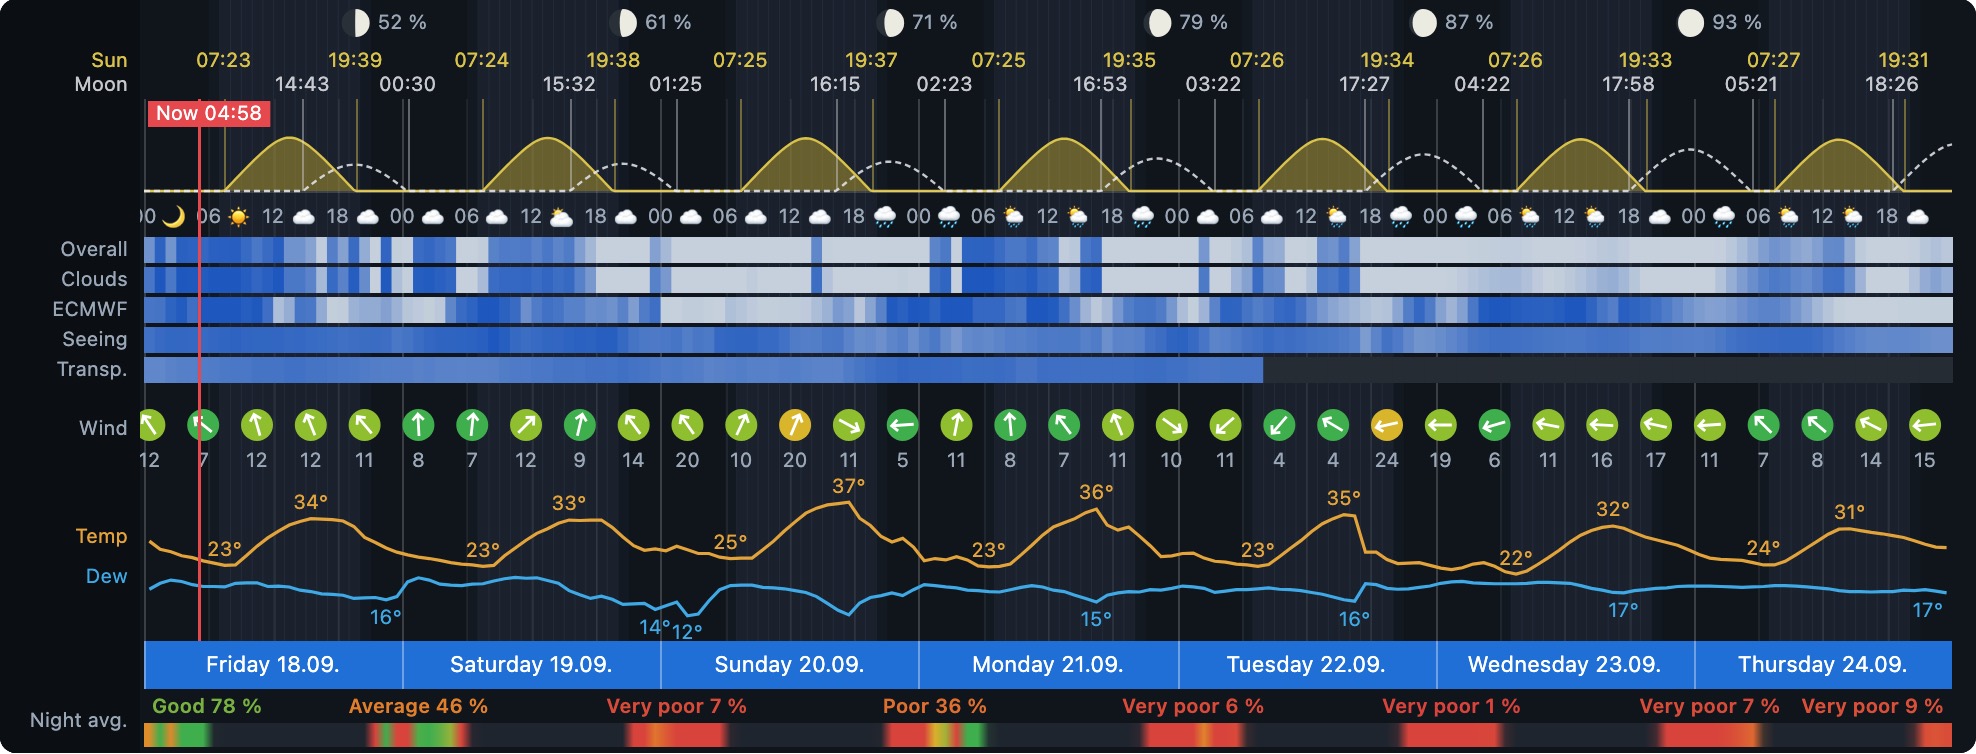
The overall row condenses each hour into a value from 0 to 100: 85 per cent and up is excellent, 65 good, 45 fair, 25 poor. Cloud dominates almost everything in it – half covered means 25 per cent at best, and that is deliberate: under solid cloud the finest seeing buys you nothing.
Below it each ingredient gets its own row, so you can see why a night scores badly: cloud, the second model’s cloud for comparison, seeing, transparency, wind with its direction, temperature and dew point. When temperature and dew point close in on each other, dew forms on the optics – which is why the spread turns amber below 4 °C and red below 2 °C.
And one night in detail
A click on a night in the table opens it up: noon to noon, hour by hour.
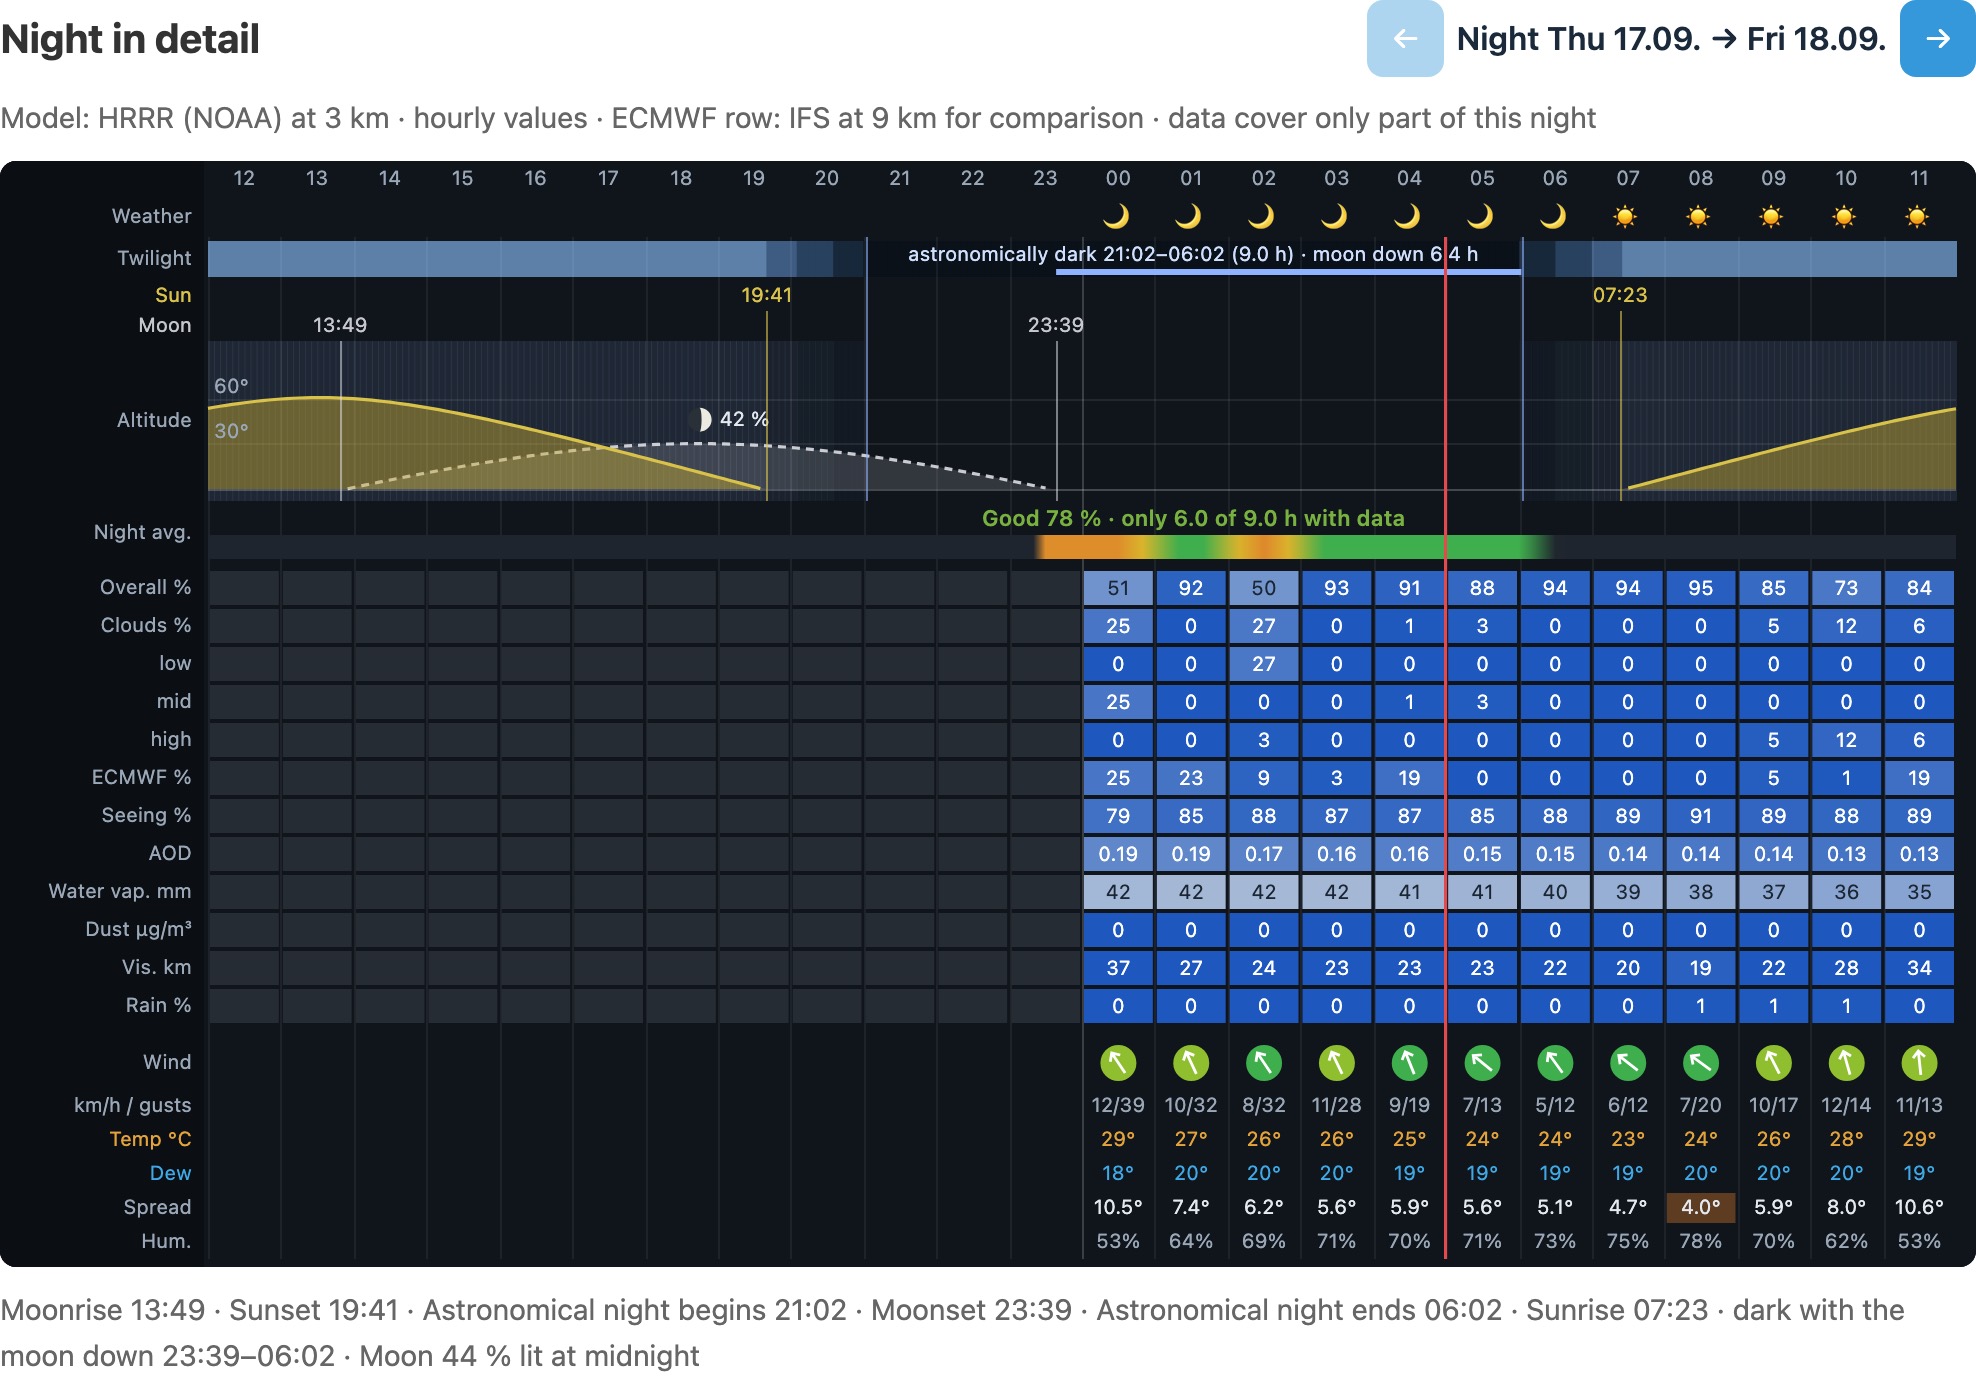
This is also where the line I care about most sits: astronomically dark 21:02–06:02 (9.0 h) – moon down 6.4 h. Nine hours of darkness is lovely, but if the moon is up for six of them at 44 per cent lit, that is a good night for narrowband and a mediocre one for RGB.
Where the data comes from
All the weather data is fetched by the browser from Open-Meteo, a Swiss service that republishes the weather services’ open data. The tool calls three endpoints and works out the rest itself:
| Source | What comes from it | Resolution |
|---|---|---|
| ICON (Germany’s DWD) | Everything measured, within Europe: cloud at three levels, temperature, dew point, humidity, wind at the ground and at four pressure levels, visibility, precipitation, weather symbols | ICON-D2 at 2.2 km first, then ICON-EU at 7 km, then global at 11 km |
| GFS and HRRR (NOAA) | The same everywhere else – including my own rig in Texas | HRRR at 3 km for about two days in North America, GFS at 13 km otherwise |
| IFS (ECMWF) | Cloud cover as a second opinion, and the column water vapour | 9 km, worldwide |
| CAMS (Copernicus) | Aerosol optical depth and mineral dust – what transparency is built on | reaches four to five days ahead, after which the row stays grey |
| meteoblue | The animated weather map under the table – someone else’s data, not part of the calculation | loads only after a second click |
| Your browser | Sun, moon, the twilight times, the moon’s phase and the moonless time – computed, not fetched | to the minute |
Free use comes with two conditions, both of which are met: the use must be non-commercial, and the source must be credited – which is why Weather data by Open-Meteo.com and its CC BY 4.0 licence sit under the chart.
Which model a night came from is printed above the night detail – HRRR (NOAA) at 3 km in the screenshot above. The box runs from 29.5 to 70.5° north and from 23.5° west to 62.5° east: inside that box ICON, outside it NOAA.
Why Texas does not run on ICON
ICON exists as a global model too, so it would have covered everywhere. Before splitting the models by region, I compared them: 30 nights around Starfront, model forecast against the cloud reports of the surrounding airports. GFS and HRRR were clearly closer to what was actually in the sky there; global ICON was the weakest of the three. Since then it has been the German model inside the ICON box and the American ones outside it.
The second cloud row, ECMWF, comes from the same mistrust. It does not feed into any rating; it simply sits there and shows whether two independent forecast centres expect the same thing. When they agree, you can plan; when they contradict each other, that plainly means the forecast is uncertain, so look again tomorrow.
Three rows are my estimate – and they are labelled as such
This is the part I most want to spell out, because at first glance it looks as official as everything else: no weather service delivers seeing, transparency or the overall rating. The tool works those out itself from the model data.
- Seeing comes from the wind profile: the jet stream at around 10 km, the shear between roughly 1.5 and 10 km, and the wind at the ground. It is the same principle the well-known seeing forecasts use – but it is a derivation, not a measurement of the turbulence.
- Transparency comes from the CAMS aerosol optical depth, damped by high humidity and by high column water vapour. After four to five days CAMS ends, and the row honestly stays grey instead of inventing something.
- Overall is a weighting of cloud, seeing and transparency in which cloud dominates quadratically. If one of the two estimates is missing, it hands its weight to the others.
Those weights are not calibrated against observations. They point in the right direction – I claim no more than that, and the page says so itself. Anyone planning a night on them should take the cloud row seriously and read the other two as a hint.
What has been checked
For everything the tool computes itself, I checked against independent sources:
- Sun and moon against the tables of the US Naval Observatory: of 48 printed rise, set and twilight times, 44 were identical and the rest one minute apart.
- The values in the tooltips against the raw response of the same request – so that nothing slips between model and display.
- Which hour a value belongs to. At Open-Meteo, gusts, precipitation and precipitation probability refer to the preceding hour, everything else to the moment. Confuse the two and you move the rain by an hour.
- Local time. Nights run from noon to noon and can have 23 or 25 hours, so the UTC offset is worked out per moment rather than once for the whole week. That is exactly where the first version came apart on the night the clocks changed.
- Which model an hour came from is detected, not guessed – from the values themselves, not from the lead time.
What the page gives away about you
A weather tool is a location lookup, and that is not something to hand over casually. So:
- Nothing happens before the click. The page loads no forecast by itself. Only Load forecast sends the request to Open-Meteo – and with it, as with any request on the internet, your IP address.
- The weather map is a two-click embed. meteoblue sets its own cookies and pulls in an analytics service, so it loads only after an explicit click – and asks again after a page reload.
- The tool itself stores nothing about you. No account, no cookies of its own, nothing stored on a server: the location and °C/°F live in the address bar. A link to a night is therefore just the link with the coordinates in it – shareable without a profile forming anywhere.
- The locations are limited to the four named above, and custom coordinates sit behind a password. The reason is the quota: free use of Open-Meteo is capped – 10,000 calls a day, and every forecast loaded is three of them. With open coordinates the page would be a weather API for the whole world, and the quota would no longer be mine. The password is no real wall: the check runs in the browser, and anyone determined gets past it. It is about stopping other people from spending my quota, not about keeping a secret.
What it cannot do
Seven days is the reach of the models, not my choice – and the last two days are a trend, not a promise. Transparency ends with CAMS after four to five days. And seeing remains a derivation from the wind: an evening when the air right above the telescope sits still while the jet stream rages is invisible to it.
What the tool deliberately does not do is the other half of the planning: where the moon stands, which objects climb high enough at all, what culminates when. That lives next door in the observing planner, which knows the same locations – and which now also says how many usable dark hours an object spends above 30°.
Conclusion
The question before the night is answered, and answered with a number you can open up and follow back to its source: the overall rating, behind it the cloud, behind that ICON or GFS, behind that a weather service with a name. What is computed is shown as computed; what is estimated is shown as estimated.
In a tool I built myself, that matters more to me than another row in the chart: you ought to be able to see how certain a statement is before you trust a whole night to it.
🔭 The tool: Astro Weather → · The other half of the planning: Observing planner → · Where the screenshots come from: My rig @ Starfront in Texas →