 Svenesis.org
Svenesis LightCurve
Version 1.0.14 – GPL-3.0-or-later
🚧 Current version 1.0.14. New since 1.0.12: the fit of a known planet is anchored to the archive’s ephemeris, systematics bases enter only by the BIC and are cross-checked on the comparison stars, the fit picks the ensemble of comparison stars itself, the site comes from the FITS header, and a tie goes to the larger aperture. Not yet in the official Siril Script Repository – download it directly from GitHub.
LightCurve does exoplanet transit photometry inside Siril – in the spirit of EXOTIC (NASA’s Exoplanet Watch pipeline) and HOPS. Point it at the folder holding one night’s sub-exposures of an exoplanet host star. It measures how that star’s brightness changed relative to other stars in the same field, removes the systematic trends it can account for, fits a transit – and tells you whether the dip is real or whether you are looking at a cloud.
Who does what
The division of labour is deliberate, and it explains most of the design.
| Responsible for | |
|---|---|
| Siril | Staging, calibration, two-pass registration, star detection, the plate solve and per-frame quality – the things it is demonstrably good at |
| The script | The flux itself: every star re-centroided per frame from its predicted position (the “follow star” Siril’s light_curve lacks), subpixel apertures against a sigma-clipped sky annulus, the aperture chosen by point-to-point noise, errors from the CCD equation with every term measured |
| And the decisions | Which star is the target, how to remove the airmass ramp without eating the transit depth – and whether to claim anything at all |
Measured on the same drifting 142-frame run: this engine keeps 140 points at 7.2 mmag point-to-point where Siril’s light_curve kept 67. The latter remains intact as the loud fallback – if the engine measures fewer than 30 per cent of the frames, it says so and hands over.
Validated against EXOTIC
Tested on EXOTIC’s own sample data (HAT-P-32 b, 142 frames): Rp/R★ = 0.1554 ± 0.0059 against EXOTIC’s published 0.1541 ± 0.0033 – 0.2 σ apart (as of v1.0.6).
Both depth conventions are reported and labelled: the limb-darkened central depth the fit measures, and the (Rp/R★)² that EXOTIC, HOPS and AstroImageJ quote – about 20 per cent shallower on a solar-type star. It is that one you should compare with theirs and with the archive.
Why not Siril’s own light-curve tool?
Siril’s light-curve workflow produces a light curve; this script produces a measurement. In between sit the follow-star re-centroiding, the drift handling and the comparison-star screening – plus the analysis the native tool ends before: BJD_TDB, a simultaneous limb-darkened fit, a calibrated significance, O−C and the AAVSO file.
Calibration finds its own frames
Nothing has to be prepared. Point at the subs – or at any folder above them, the scan is recursive and sorts by FITS header – and, once, at the folder where your reusable darks live. The flats are found beside the lights in the N.I.N.A. layout, grouped by exposure, gain, temperature, binning, image size and camera, stacked into masters and cached for the next run. The pixel work is Siril’s calibrate – there is no bias, dark or flat arithmetic in this script, for the same reason there is no photometry in Siril.
What gets refused is said out loud – because a master that was found and then rejected leaves a run that looks exactly like one where no master existed:
| Refused | Why |
|---|---|
| Wrong exposure (dark) | A 3-second dark on 60-second lights removes 5 % of the dark current, leaves the rest standing, and lays its own read noise onto every frame. Reported with both numbers – and with what it would have done |
| Wrong temperature | Darks are grouped by temperature; averaging −10 °C and −20 °C together is right for neither. Temperature is demanded only where the sensor’s thermal signal is what the master removes – dark against light, flat-dark against flat. Bias is not split – it is pure read noise, and splitting it would only make every master noisier |
| Wrong camera or size | Two bodies with the same sensor format would otherwise calibrate each other |
| Bias together with a dark | The dark already carries the offset; subtracting both removes it twice. The bias goes on correcting the flats instead |
A flat, on the other hand, does not have to match the exposure of the lights – a flat is a ratio, and its own exposure time says nothing about them. Since 1.0.9 the same holds for temperature: a flat shot on a warmer night still calibrates, and a bias does anyway, being pure read noise. Still take flats near the session’s focus – temperature moves the focuser, and dust shadows change size with it. That is an optical reason, not a thermal one.
Registration without resampling
register -2pass computes the registration data and stops. seqapplyreg would interpolate every pixel – and interpolation correlates neighbouring noise and moves flux inside the aperture. Instead the photometry follows the stars through the registration data: the aperture lands on the star while the pixels stay exactly as the sensor recorded them.
Detrending the airmass ramp without eating the depth
A plain fit through every point absorbs part of the transit whenever the dip correlates with the ramp – the standard case for a target that sinks through the night. So the baseline is first fitted with a one-sided least-trimmed pass, then re-fitted directly on the points outside the transit window.
Measured on synthetic runs with a known 30 mmag-per-airmass ramp: a plain fit recovers the slope 6 to 11 per cent low; this lands within one per cent up to 50 per cent duty cycle, and within three at 75.
Is it real? A floor that was measured
The significance test is two-sided. A real transit returns to the baseline it left; a trend does not. Pooling both sides into one out-of-transit mean loses exactly that difference: on a monotonic ramp with no transit in it – uncorrected extinction, a drifting cloud, focus creep – the pooled contrast reaches +25σ. Comparing each side separately and taking the weaker one, the same data return −10σ and are refused.
The significance is the best of some 40,000 grid nodes, so it is not a Gaussian σ. That is why the floor was not chosen but measured – over 1,200 transit-free noise runs through that same search:
| Floor | False alarm | 4 mmag | 6 mmag | 8 mmag | 12 mmag |
|---|---|---|---|---|---|
| 3.0 σ | 7.67 % | 88 % | 100 % | 100 % | 100 % |
| 3.5 σ | 1.92 % | 70 % | 97 % | 100 % | 100 % |
| 4.0 σ | 0.50 % | 45 % | 93 % | 100 % | 100 % |
| 4.5 σ | 0.25 % | 29 % | 89 % | 100 % | 100 % |
| 5.0 σ | 0.00 % | 15 % | 78 % | 100 % | 100 % |
A 3σ floor lets one run in ten through – where “3σ” is generally read as one in 750. The measured rate is printed next to every result. And a transit clipped by the start or end of the run returns zero significance, not merely less: without baseline on both sides, no method can answer the question.
Two questions, two fit modes
Everything described so far answers the question is there a transit? HOPS, the pipeline ExoClock observers work with, answers a different one: given the planet from the catalogue – how deep was the transit, and when was mid-transit? Both questions are legitimate; they are simply not the same fit. Since 1.0.7 a dropdown chooses between them:
| Blind detection (default) | HOPS-compatible | |
|---|---|---|
| Duration and shape | free, searched over a grid of templates | fixed by the planet’s orbit from the archive |
| Limb darkening | quadratic law, coefficients matched to star and filter | Claret law with four coefficients, from the Claret field or computed automatically from a Phoenix model for the star’s Teff and log g |
| Exposure | model at mid-exposure | averaged across each exposure in 10-second substeps |
| Error bars | covariance times a red-noise factor | from a sampled posterior, percentiles 16/50/84 |
The mode was checked head to head against pylightcurve’s own fitting class: outlier count and scale factor identical, Rp/R★ and mid-transit within 0.1 σ. Unlike HOPS, the sampler is seeded – a second run returns the same numbers.
Which limb darkening. Up to version 1.0.11 the coefficients were 0.35/0.23 for every star and every filter – right for a Sun-like star in a broad visual band, a 3–6 per cent systematic on Rp/R★ for anything else, and no error bar showed it. Since 1.0.12 both modes take the coefficients from the best source at hand: the Claret field when it is filled, else an automatic Phoenix computation for the archive’s Teff and log g and the run’s filter (the first call per star downloads about four model files of 21 MB each), else the defaults. The blind fit uses the quadratic pair closest to the Claret profile, and the log and the report name the source. The fit is also weighted now: the per-point errors enter as relative weights, so the noisy near-horizon end of a run no longer inflates the error bars; with constant errors every number stays the unweighted one.
What does not change: the blind significance test still runs first and alone decides whether a transit is claimed. The HOPS mode measures the planet from the catalogue; it does not check whether it is there. If the blind test did not clear the floor, the HOPS numbers are the measurement of a transit nobody demonstrated in these data – and the run says so every time.
Anchored, selected, cross-checked
Since 1.0.13 three rules decide what the fit may do with a known planet – the ones TFOP’s follow-up guidelines and AstroImageJ’s users apply.
Anchored on the ephemeris. When the archive knows the planet, mid-transit is searched only within a window round the prediction – the ephemeris error grown over the epochs, times three, never under 30 minutes – and the duration only within 15 per cent of the archive’s; the period is fixed. Depth and systematics stay free, which is exactly how EXOTIC and TFOP fit a known planet. A free mid-time and duration remain the tool for a signal without an ephemeris, and the free scan runs alongside every anchored fit as a cross-check, in the log and in the report. On JD_UTC times there is no anchor: an archive T0 is BJD_TDB and would be minutes off.
Bases by the BIC. Airmass, and the meridian-flip step where one was seen, are always in. Seeing, sky level, star count and the target’s x/y drift enter only when they lower the Bayesian Information Criterion by 2 or more. Why that matters was measured on a night of TOI-2040.01: with all six bases offered unasked and a free duration, a seven-pixel drift of the star stretched the 2.6-hour transit to 3.5 hours and took a 6 σ detection down to 1 σ – without lowering the residual scatter at all. Anchored, the BIC rejects that same basis, and the fit gives (Rp/R★)² = 1.42 % against TESS’s 1.47 %, the mid-time 0.1 minutes from the prediction. On EXOTIC’s HAT-P-32 set the same drift earns its place and stays.
A basis that stays is measured on the comparison stars. A flat-field residual or a pixel-phase effect moves every star that drifts across the same pixels; a transit moves one. So each active comparison star is fitted against the ensemble of the others, and the target’s slope must sit within two sigma of what the ensemble shows. A dependence only the target follows is called out in red – it is fitting the transit.
The aperture is chosen, not assumed
Aperture size is the most consequential number in aperture photometry. Too small loses a seeing-dependent fraction of the star – a systematic that drifts with the night. Too large collects sky and neighbours. So several radii are measured, and the one with the least noise wins. The script’s own photometry measures its grid of 0.9 to 2.5 × FWHM in a single pass and chooses by point-to-point noise. Since 1.0.12 the grid scales with the run’s median seeing instead of the reference frame – that is the frame with the best seeing, and a grid scaled to it would be too small on every other frame –, and a radius whose curve follows the seeing is passed over, because point-to-point noise cannot see that slow loss of flux. When Siril’s light_curve measures the run, six radii from 0.75 to 2.5 × FWHM are each photometered once; ties are broken by the number of frames measured – an aperture that scores well because it measured fewer frames has won nothing. Since 1.0.14 size breaks a tie in both grids as well: two radii within 3 per cent are one aperture to point-to-point noise, while the smaller one may still lose a seeing-shaped share of the star – so the larger one wins. Measured on TOI-2040.01: 1.1 × FWHM won by 1.9 per cent and read 1.18 per cent deep, while 2.0 × FWHM on the same night read 1.33 per cent against TESS’s 1.47 per cent.
Comparison stars
Four filters decide, each against a different failure:
| Dropped when | Why |
|---|---|
| Saturated | A clipped core does not scale with transparency – one saturated comparison star turns every cloud into a false transit |
| SNR below the limit | Every comparison star brings its own photon noise into the ensemble. Below about 20 it adds more scatter than it is worth as a reference |
| Closer than 10 × FWHM | The apertures share sky annulus and stellar wings. The contamination depends on the seeing, so it drifts through the night and looks like a slow trend |
| Not isolated | The same argument, pointed at every neighbour of the comparison star. The radius is Siril’s own geometry, not taste: -autoring puts the outer ring at 6.3 × FWHM, so two annuli stop touching at twice that |
Beyond that, every candidate is photometered against the others and judged on the robust scatter of its own curve. A star that wobbles against its peers writes that wobble, inverted, into the target curve – and nothing else would ever notice. The threshold is a ratio to the ensemble median, not an absolute millimagnitude: a good and a bad night differ by a factor, and a fixed limit would reject everything in one and nothing in the other.
Every rejection appears in the log and the report – and the tally also counts the stars that passed all four filters and simply were not needed. Without that line, “6 chosen, 668 rejected” out of 864 detections reads like a field that barely yielded a comparison star – when in fact it yielded 195, and the best six were taken.
And chosen by the fit, since 1.0.13. EXOTIC keeps the one comparison star whose fitted curve leaves the smallest residual; with HOPS and AstroImageJ you untick the bad curve by hand. Here both happen automatically for the whole ensemble: after the photometry, worst first, a comparison star drops out while the anchored transit fit’s residual scatter falls by 2 per cent or more without it, and two always stay. Why the scatter test alone is not enough showed on EXOTIC’s HAT-P-32 set: a bright comparison star with 27 mmag of slow structure passed it, carried a third of the ensemble and took Rp/R★ from 0.156 to 0.164 against EXOTIC’s 0.154. Its own scatter was unremarkable – only the fit saw what it did to the depth.
Clipping is not variability
A pixel at the ceiling cannot get brighter. A comparison star whose core sometimes sits at the ceiling – above it in the good-seeing frames, just below otherwise – therefore scatters exactly the way a variable star would. The scatter check cannot tell the two apart.
This surfaced on the first run with flats: Siril clamps calibrated frames to the range [0, 1], and the flat division lifted stars near the edge into that ceiling which their raw frames had never touched. 73 of 223 points went missing without a word – found only because two runs were compared by hand. Three guards now stand against it: a comparison star whose brightest pixel already sits at 70 per cent of the clipping limit is dropped up front and replaced by the next best one in reserve; any star that still clips in individual frames is listed with the count; and every missing frame is named with its reason. Nothing vanishes unnamed any more.
One satellite must not cost the detection
Measured on a real 12 mmag transit at 4 mmag per point: a single 100 mmag outlier took the significance from 12.1σ to 3.2σ – under the detection floor. A measured transit was reported as not claimed.
What is striking is that the parameters barely moved. What broke was the denominator – the scatter behind the significance was an ordinary RMS, and one outlier inflates it. Switching to a MAD recovers 6.9σ, and removing the point recovers the rest. The reference is a nine-point running median – far shorter than any transit, so a smooth multi-point dip passes untouched. No more than 5 per cent of a run is ever removed; above that the outliers are the data, and the run says exactly that.
The chart carries the whole result
A screenshot of the curve should be a complete measurement, not a teaser. So the legend quotes T0 and Rp/R★ with errors and names the detrending bases; points dropped by the spike filter appear as red crosses instead of quietly vanishing – you judge for yourself whether it was a satellite or an egress. The residual panel reports its scatter and the lag-1 autocorrelation with a verdict, the red-noise indicator that separates clean noise from a systematic left behind.
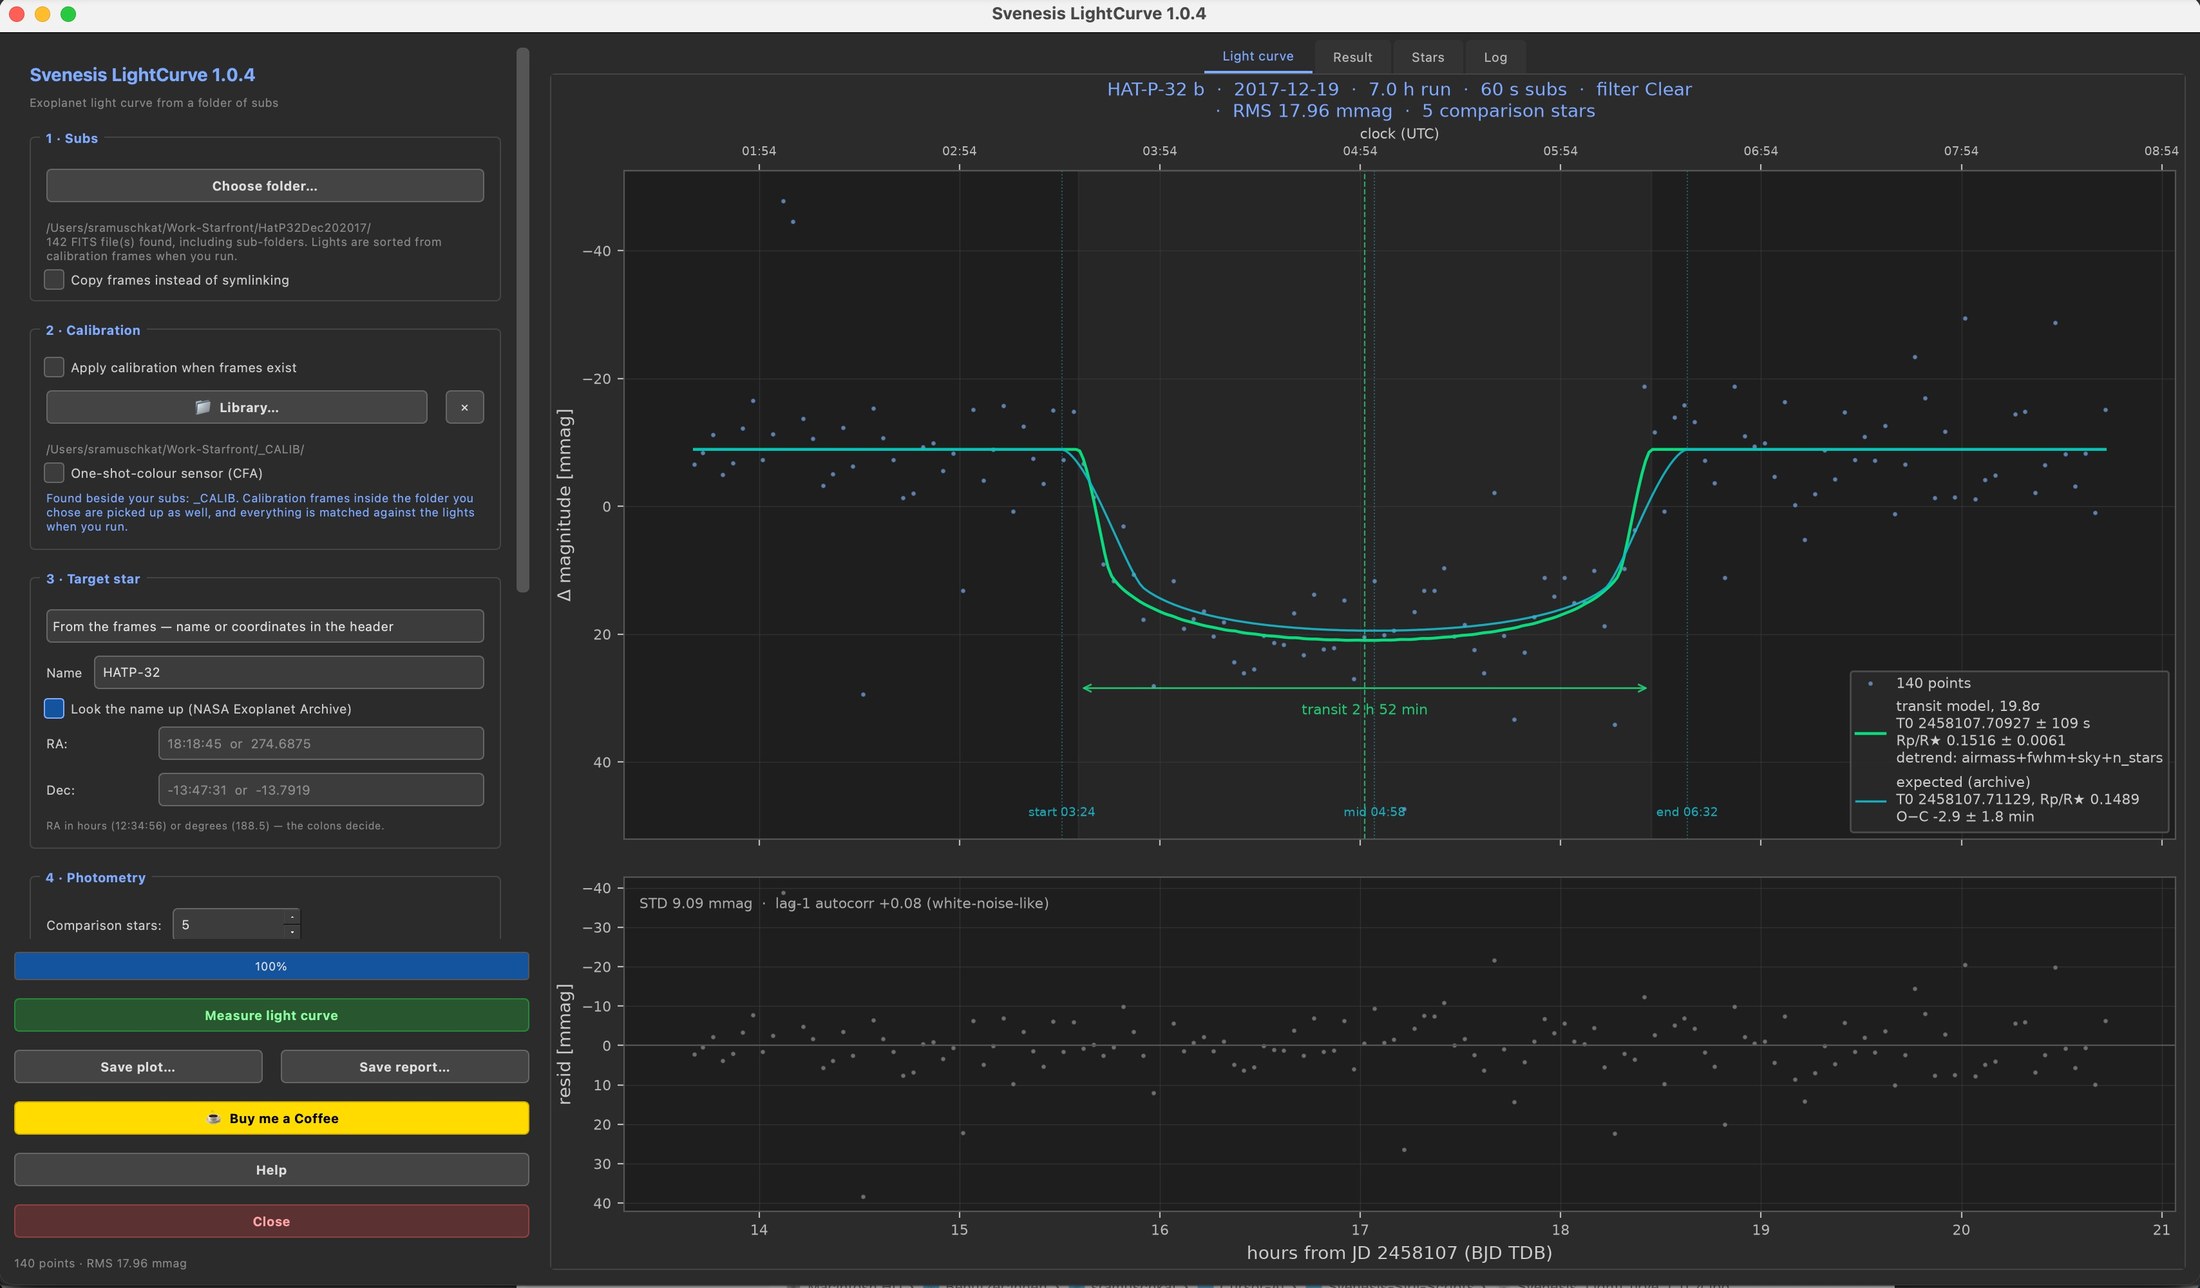
The expected transit is always drawn – whether or not the fit claimed anything. On a detection the offset between the fitted and the expected curve is the O−C, quoted in minutes with its error; exactly the number ExoClock and the ETD collect. On a non-detection the prediction is the more valuable half: if the transit fell inside the window, the legend says “no transit claimed by the fit” – both facts in one picture. If it fell outside, it names the nearest mid-transit in hours from your run. So you know whether the night missed the transit or the transit missed the night.
And the chart speaks your planning tool’s language. A night is planned in clock time but measured in Julian dates – so a second time axis runs across the top in hours and minutes: in local time when the frames carry N.I.N.A.’s DATE-LOC, in UTC otherwise, and the axis says which. The predicted contact times are stamped underneath as clock times, and a meridian flip is marked with a dashed line exactly where the field turned – so you can see by eye whether a step coincides with it. The vertical lines follow a fixed grammar:
| Line | Meaning |
|---|---|
| Orange dashed | the meridian flip |
| Cyan dotted | the predicted contact times: start, mid, end |
| Coloured dashed | mid-transit – and that one exists only for a claimed detection |
The last point is the important one: an unclaimed fit keeps its honestly labelled curve but gets no detection markers. Otherwise a 0.0σ fit that has latched onto the flip step would put a second dashed line right beside the real one.
TESS candidates
A target called TOI-3540.01 is a candidate designation, and the confirmed-planet table cannot know it. Losing the whole ephemeris over that – the expected curve, the O−C, the transit window – would be a typo nobody made. So when the planet lookup comes back empty and the name matches the TOI pattern, the archive’s TOI list is queried instead. The TFOPWG disposition is said out loud, not swallowed: PC, CP, KP and APC are informative, while FP and FA get a red warning that a “transit” on this ephemeris is most likely not a planet – and the warning repeats on cache hits, because a cached false positive is still a false positive.
A candidate does not get through the AAVSO form: it checks #EXOPLANET_NAME against the table of confirmed planets, and for a TOI there is no suffix letter to add. The log and the file’s #NOTES say so and point to ExoFOP-TESS, where follow-up observations of candidates are submitted. Since the archive has no a/R★ or inclination for candidates, the EXOTIC lines #PRIORS and #RESULTS carry the orbit the HOPS-compatible mode derived from the duration.
The output
| File | Contents |
|---|---|
lightcurve.csv | Every point: JD, raw, centred, detrended, error, airmass |
lightcurve.png | The plot |
field.png | The field image the AAVSO form asks for: the reference frame with the target circled in green, the comparison stars used numbered C1…, north/east arrows and a 5′ bar; shrinks itself below 2 MB |
results.txt | The fit in the exact layout of HOPS’ results.txt – whatever reads a HOPS fitting folder reads this file unchanged |
report.txt | The whole run as text – comparison stars, every rejection and its reason, the method and the result |
AAVSO_exoplanet.txt | In Exoplanet Watch’s format and EXOTIC’s layout: the fields the upload form requires – #STAR_NAME, #EXOPLANET_NAME, #EXPOSURE_TIME and #MEASUREMENT_TYPE=Rnflux – the AAVSO filter code from the filter field or the FITS header, plus T0 ± error, both depth conventions, Rp/R★ ± error and duration in the header; the columns hold the relative normalised flux with airmass and the fitted systematics model as detrend. ERR includes scintillation after Young’s formula once the telescope aperture is known (APTDIA in the header or the field in the script) – about 3–4 mmag per 60 s at airmass 1.5 on a 30 cm telescope; when it is missing, the log says so |
EXOTIC/ | The same run as an EXOTIC output folder: AAVSO_<planet>_<date>.txt with EXOTIC’s full header, FinalLightCurve_….png/.pdf and in temp/ CSV, JSON, plots and PlateStatus_….csv (why a frame yielded no measurement) |
HOPS/ | The same run as a HOPS observation folder: PHOTOMETRY_1/ with PHOTOMETRY_APERTURE.txt and friends, in the HOPS-compatible mode PHOTOMETRY_APERTURE_FITTING/, plus the export files for ExoClock and ETD |
⚠️ The AAVSO file is refused unless the times are BJD_TDB. The header declares that system; writing JD_UTC underneath would hand a submission an eight-minute error nobody can see. Nothing is sent anywhere – submitting stays your decision.
Taking good data
| Baseline | Start at least one transit duration before ingress and keep running just as long after egress |
| Do not saturate | Neither the target nor the comparison stars. Keep the peak below about half full well |
| Defocus slightly | Counter-intuitive but standard: spreading the star over more pixels averages out flat-field errors and buys saturation headroom. FWHM 4–6 px is a good target |
| Do not dither | The opposite of the stacking advice. Dithering moves the star onto pixels of different sensitivity – noise you do not need when the star is holding still anyway |
| Keep the exposure | Changing it mid-run alters saturation headroom and scintillation statistics at the same time |
Requirements
Siril 1.4+ with Python support, numpy, PyQt6, matplotlib, astropy – the dependencies install themselves on first start. Ten frames is the absolute minimum; a real transit run has hundreds. The airmass detrend needs the latitude and longitude of the site. Where the frames carry them as SITELAT/SITELONG, the header’s site has won since 1.0.13 and is written into the fields; the form is the fallback for frames without one, and the override on request. If the two sit more than 50 km apart, the run says so. With no site at all the detrend is skipped, and the report says so.
The script comes with a test suite: tests/test_lightcurve_helpers.py runs under plain python3 with no Siril, and checks over 880 cases against input with a known answer – synthetic transits of stated depths through the full photometry and fit chain, twelve pure-noise runs that must not be claimed, and error bars calibrated against 24 independent synthetic nights.